
















Copyright: ©Author(s) 2026.
World J Gastrointest Surg. May 27, 2026; 18(5): 116488
Published online May 27, 2026. doi: 10.4240/wjgs.v18.i5.116488
Published online May 27, 2026. doi: 10.4240/wjgs.v18.i5.116488
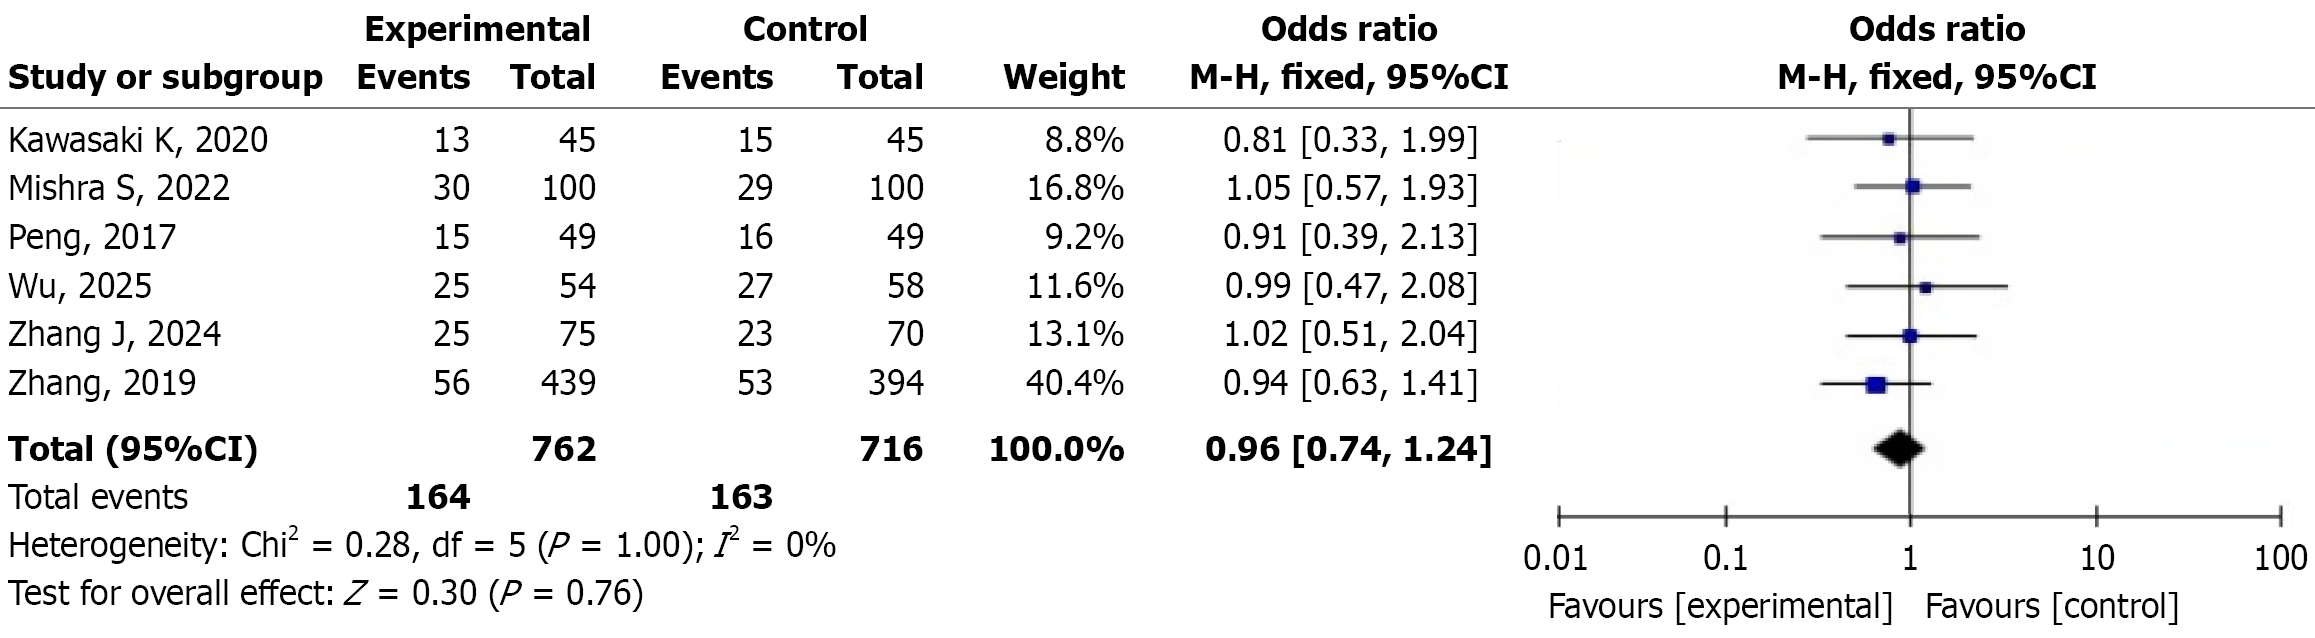
Figure 6 Meta-analysis of postoperative complication rates in both groups.
Including 6 studies, analyzed using a fixed-effects model. Pooled odds ratio = 0.96 (95% confidence interval: 0.74-1.24, P = 0.76), suggesting no statistically significant difference between groups. Heterogeneity test I2 = 0% (P = 1.00), with excellent homogeneity among studies. Squares represent individual study effect sizes, and the diamond represents the pooled effect size. CI: Confidence interval.
- Citation: Xie XX, Wang ZH, Zhang SL, Yang W. Effect of Chinese herbal medicine enema on postoperative gastrointestinal function in gastric cancer patients: A meta-analysis. World J Gastrointest Surg 2026; 18(5): 116488
- URL: https://www.wjgnet.com/1948-9366/full/v18/i5/116488.htm
- DOI: https://dx.doi.org/10.4240/wjgs.v18.i5.116488