
















Copyright: ©Author(s) 2026.
World J Gastrointest Surg. May 27, 2026; 18(5): 116135
Published online May 27, 2026. doi: 10.4240/wjgs.v18.i5.116135
Published online May 27, 2026. doi: 10.4240/wjgs.v18.i5.116135
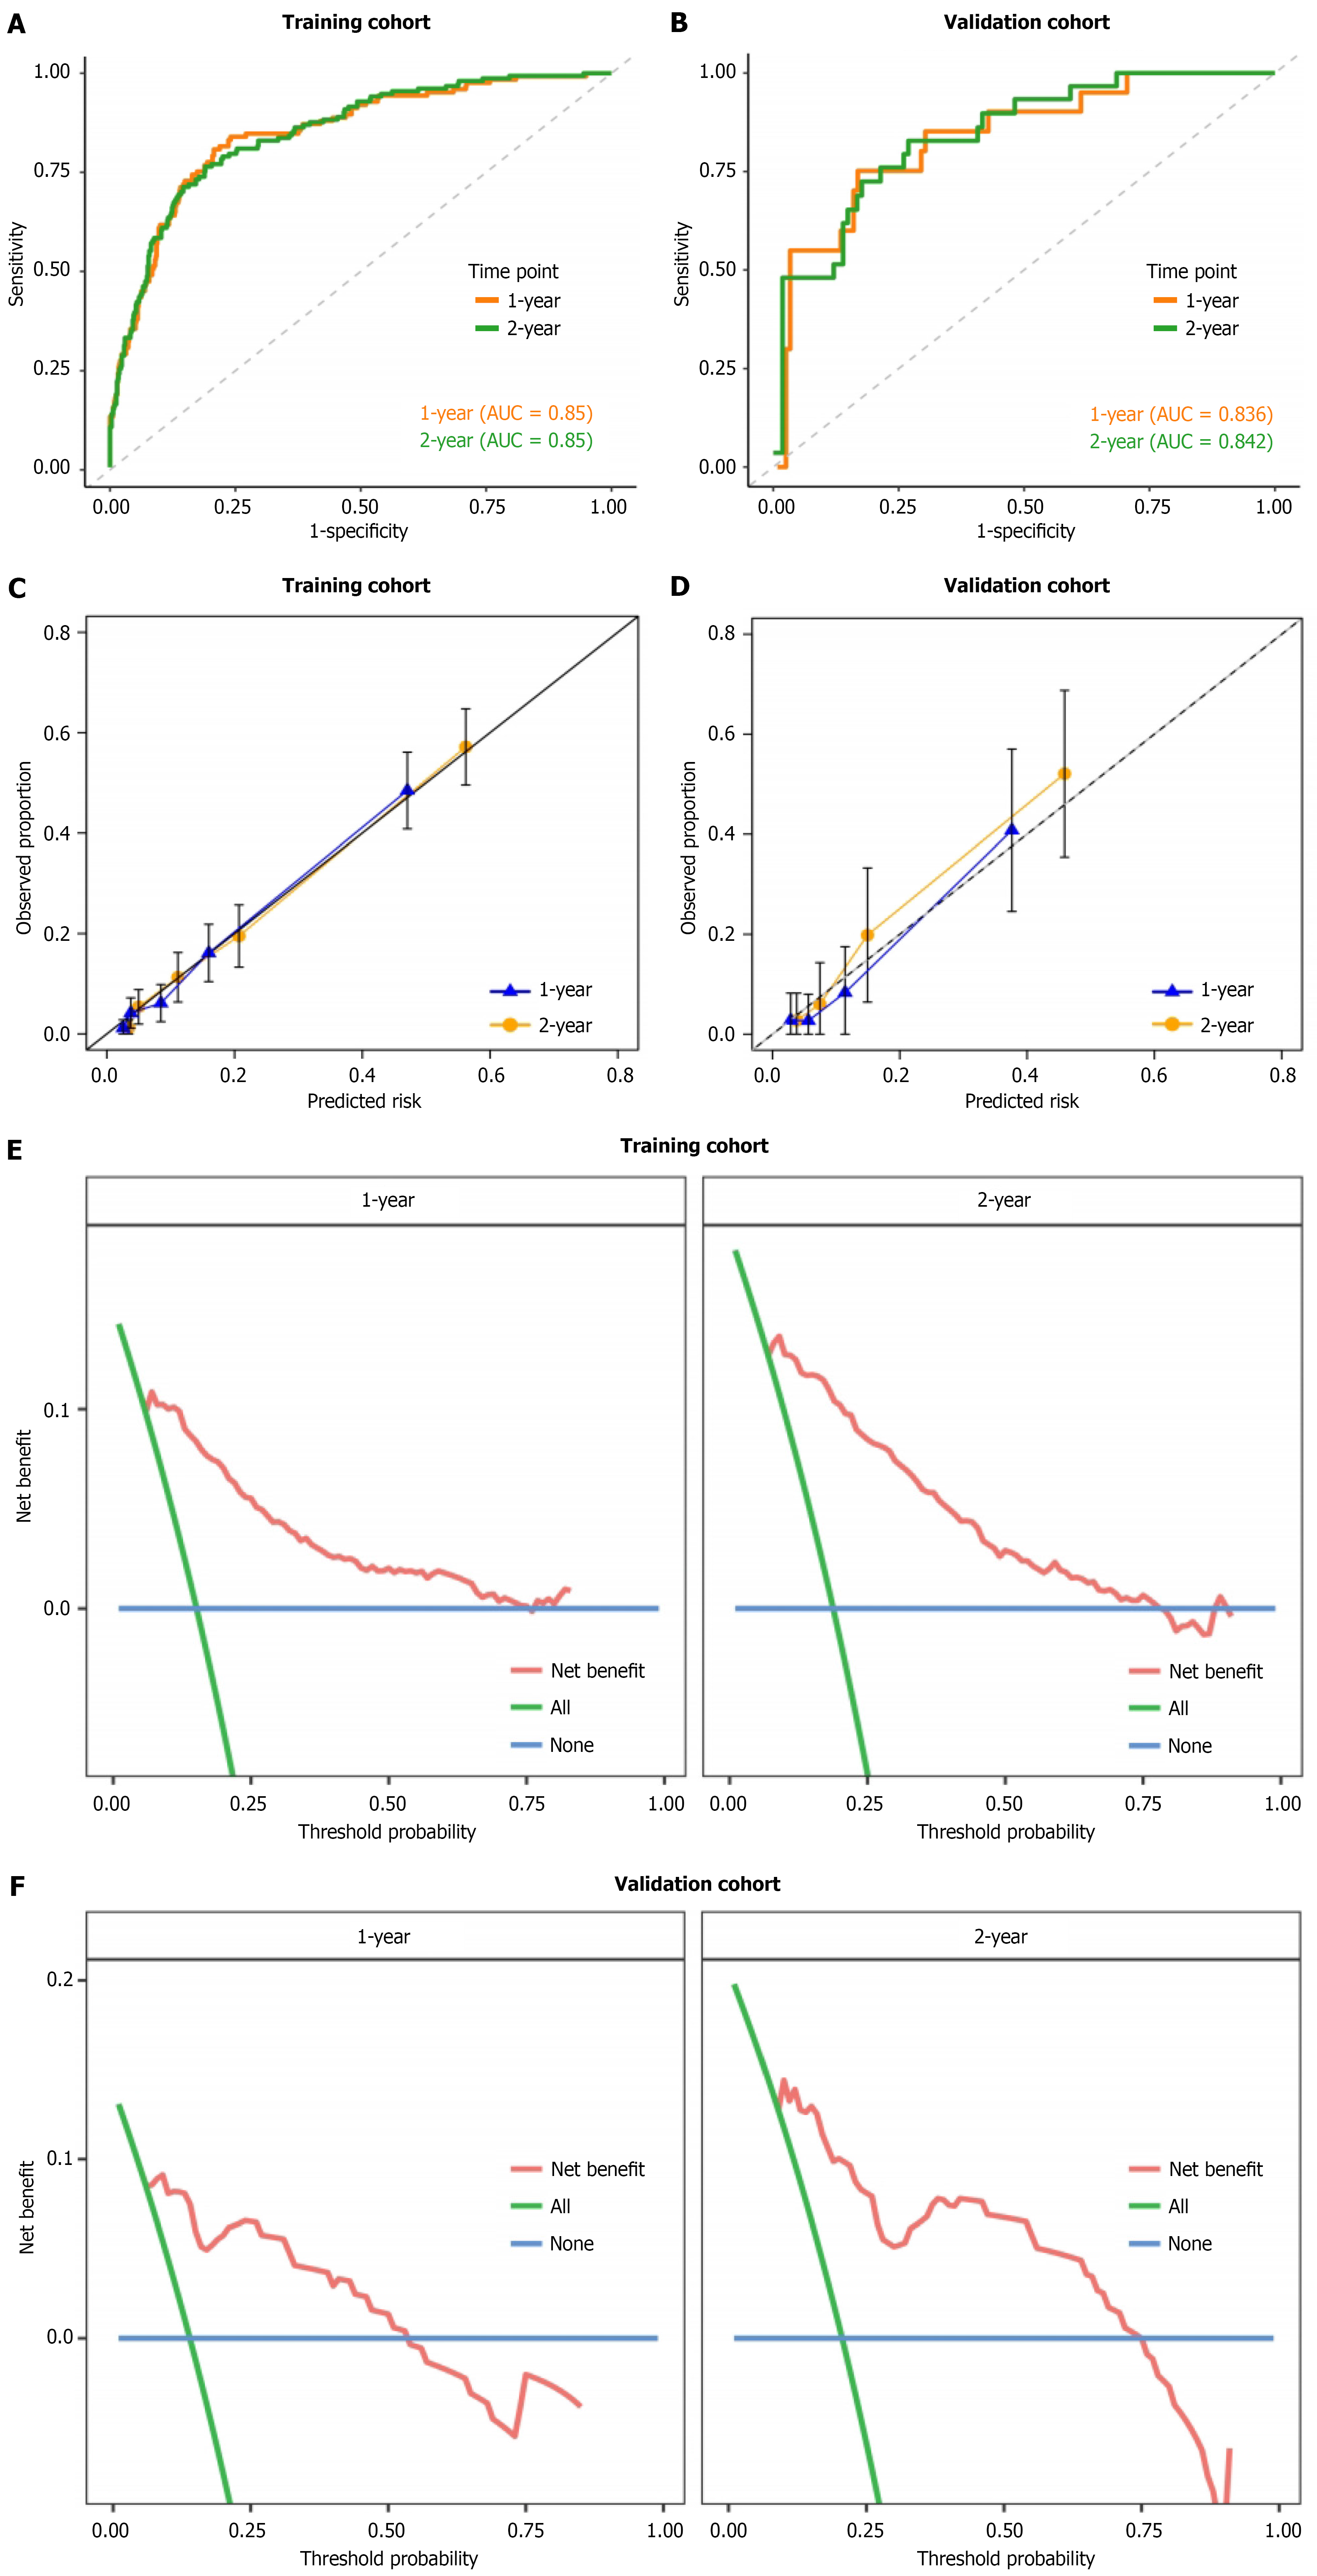
Figure 6 Performance evaluation of the predictive nomogram.
A: Time-dependent receiver operating characteristic curve for 1-year and 2-year aggressive recurrence in the training cohort; B: Time-dependent receiver operating characteristic curve for 1-year and 2-year aggressive recurrence in the validation cohort; C: Calibration plot comparing predicted vs observed probabilities at 1 year and 2 years in the training cohort; D: Calibration plot at 1 year and 2 years in the validation cohort; E: The 1-year and 2-year decision curve analysis curves of the training cohort; F: The 1-year and 2-year decision curve analysis curves of the vali
- Citation: Deng QY, Leng HQ, Wang TC, Hu C. Establishment and validation of an intratumoral fibrosis-based nomogram for predicting aggressive recurrence after liver resection in hepatocellular carcinoma. World J Gastrointest Surg 2026; 18(5): 116135
- URL: https://www.wjgnet.com/1948-9366/full/v18/i5/116135.htm
- DOI: https://dx.doi.org/10.4240/wjgs.v18.i5.116135