
















Copyright: ©Author(s) 2026.
World J Gastrointest Surg. Mar 27, 2026; 18(3): 115906
Published online Mar 27, 2026. doi: 10.4240/wjgs.v18.i3.115906
Published online Mar 27, 2026. doi: 10.4240/wjgs.v18.i3.115906
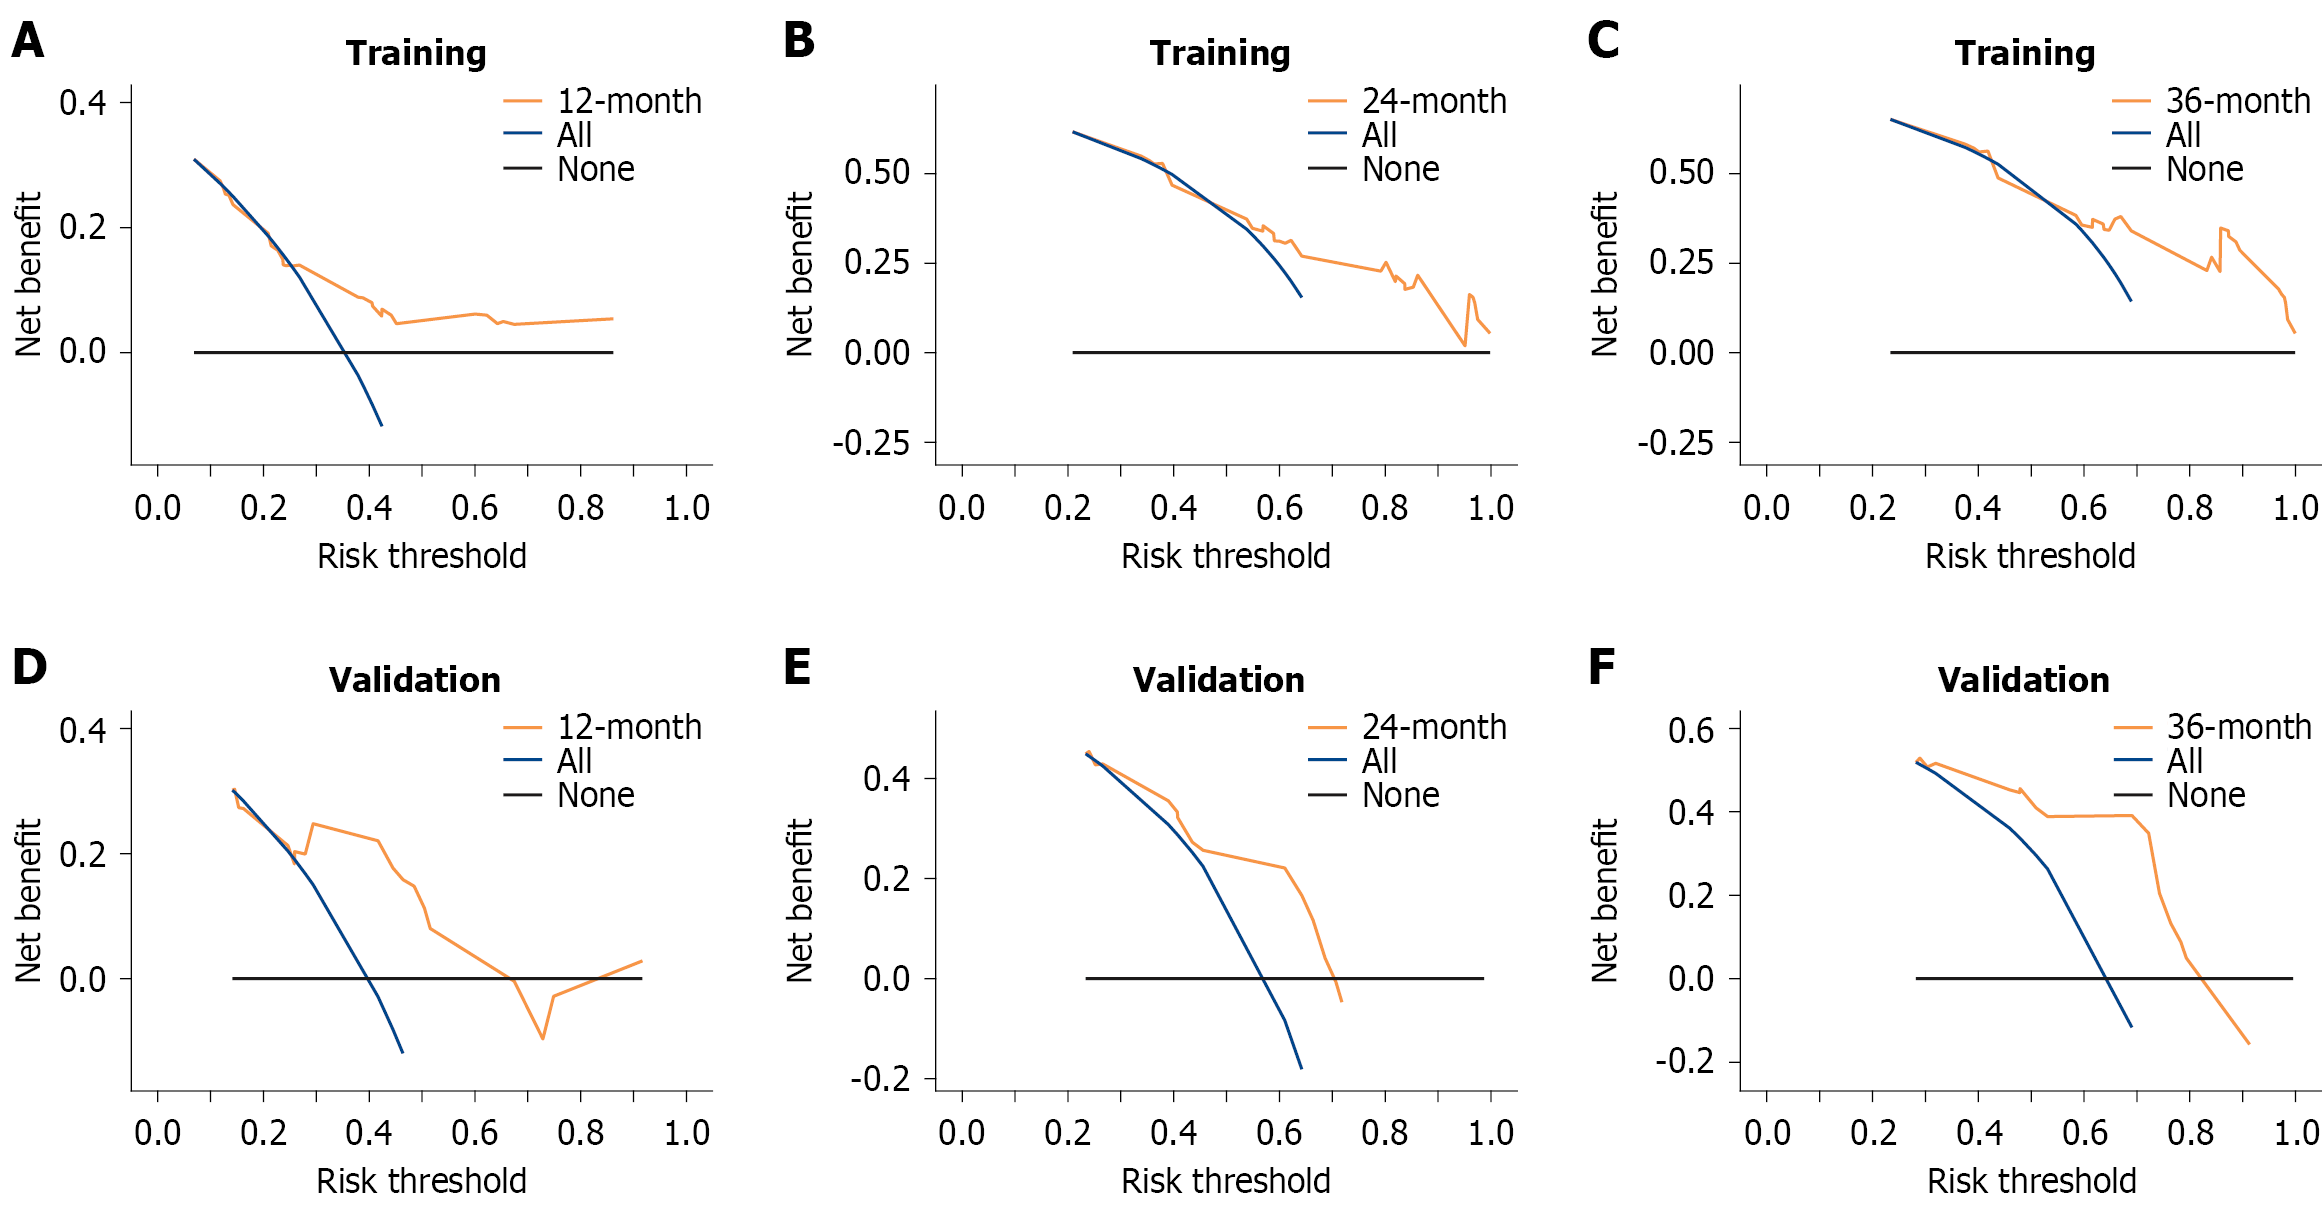
Figure 6 Decision curves of the nomogram prediction model in the training and external validation cohorts for predicting overall survival 1 year, 2 years, and 3 years after surgery.
The blue line represents the net benefit of the intervention strategy for all patients. The black line indicates the net benefit without any intervention strategy. The vertical axis represents the overall net benefit. A: The decision curves of the nomogram prediction model in the training cohorts for predicting overall survival 1 year after surgery; B: The decision curves of the nomogram prediction model in the training cohorts for predicting overall survival 2 years after surgery; C: The decision curves of the nomogram prediction model in the training cohorts for predicting overall survival 3 years after surgery; D: The decision curves of the nomogram prediction model in the external validation cohorts for predicting overall survival 1 year after surgery; E: The decision curves of the nomogram prediction model in the external validation cohorts for predicting overall survival 2 years after surgery; F: The decision curves of the nomogram prediction model in the external validation cohorts for predicting overall survival 3 years after surgery.
- Citation: Tang J, Ding SL, Wu Y, Wu YP, Yuan XB, Wu PF, Sha DS. Prognostic value of a nomogram model for pancreatic cancer incorporating the systemic immune-inflammation and prognostic nutritional indices. World J Gastrointest Surg 2026; 18(3): 115906
- URL: https://www.wjgnet.com/1948-9366/full/v18/i3/115906.htm
- DOI: https://dx.doi.org/10.4240/wjgs.v18.i3.115906