
















Copyright: ©Author(s) 2026.
World J Gastrointest Surg. Mar 27, 2026; 18(3): 115906
Published online Mar 27, 2026. doi: 10.4240/wjgs.v18.i3.115906
Published online Mar 27, 2026. doi: 10.4240/wjgs.v18.i3.115906
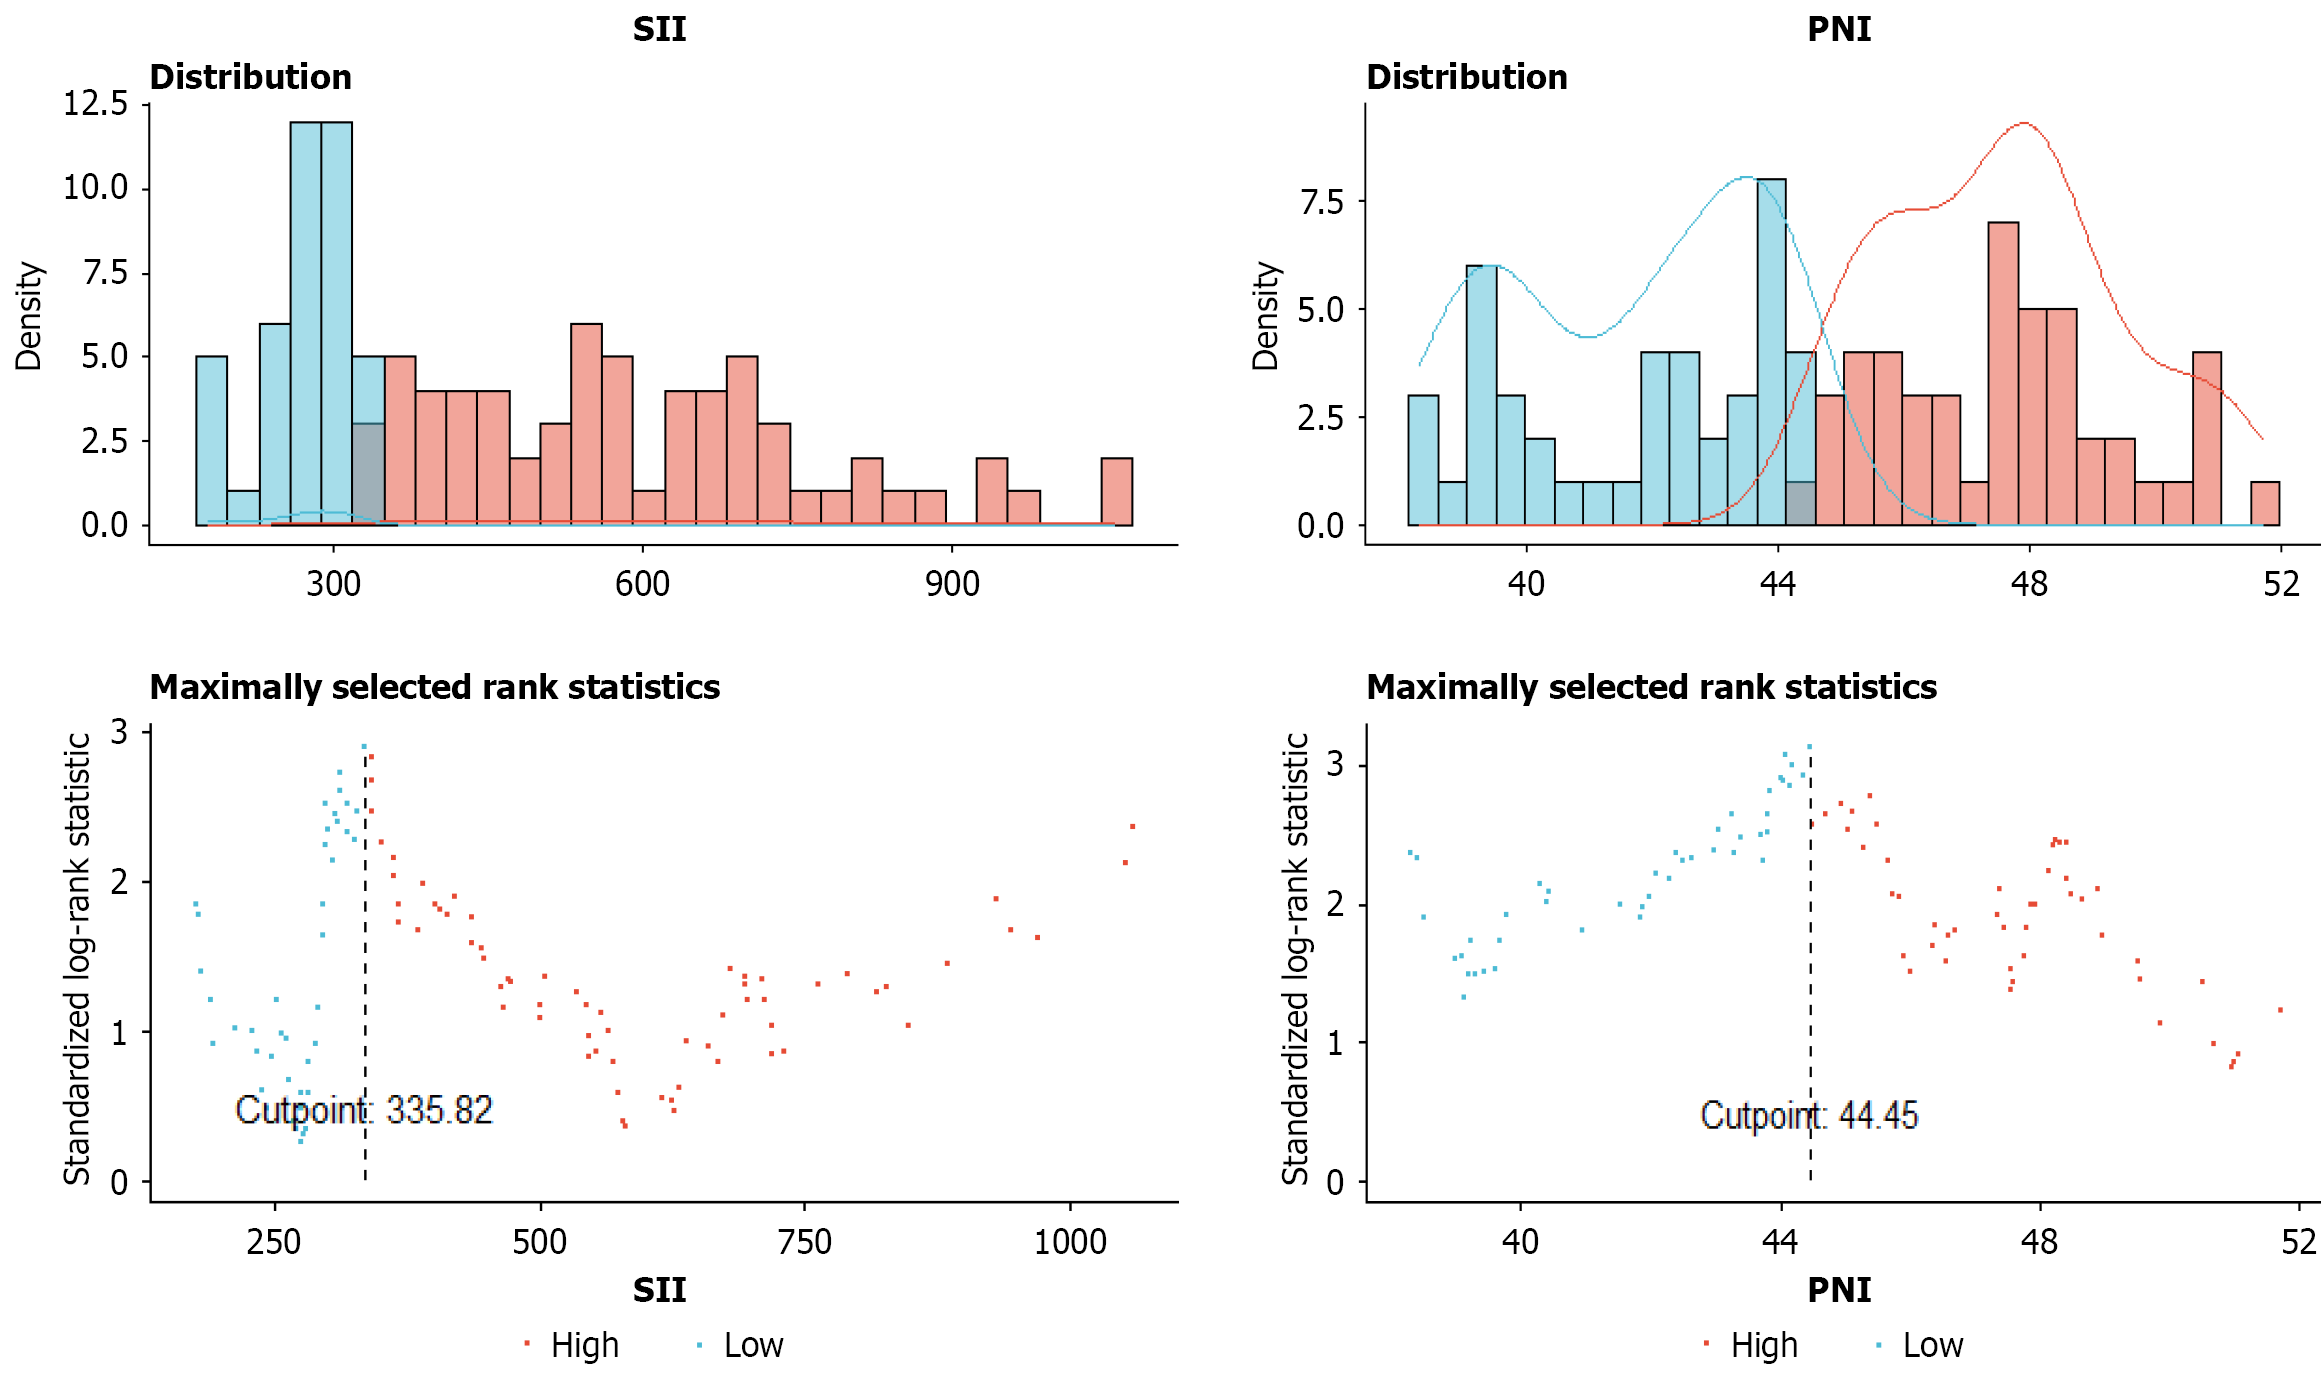
Figure 2 Calculation for the optimal systemic immune inflammation index and prognostic nutritional index cutoff values.
The basic principle of the surv-cutpoint function was based on patient overall survival, and the Kaplan-Meier curve was used to determine the best cutoff value. The survival differences between the two groups were tested by a log-rank test. The survival rates on both sides of a specific point had the greatest difference when the χ2 statistic of the log-rank test was the largest. The measured values corresponding to the maximum χ2 statistic were the optimal systemic immune inflammation index and prognostic nutritional index cutoff values. SII: Systemic immune inflammation index; PNI: Prognostic nutritional index; grps: Groups.
- Citation: Tang J, Ding SL, Wu Y, Wu YP, Yuan XB, Wu PF, Sha DS. Prognostic value of a nomogram model for pancreatic cancer incorporating the systemic immune-inflammation and prognostic nutritional indices. World J Gastrointest Surg 2026; 18(3): 115906
- URL: https://www.wjgnet.com/1948-9366/full/v18/i3/115906.htm
- DOI: https://dx.doi.org/10.4240/wjgs.v18.i3.115906