
















Copyright: ©Author(s) 2026.
World J Gastrointest Surg. Mar 27, 2026; 18(3): 115137
Published online Mar 27, 2026. doi: 10.4240/wjgs.v18.i3.115137
Published online Mar 27, 2026. doi: 10.4240/wjgs.v18.i3.115137
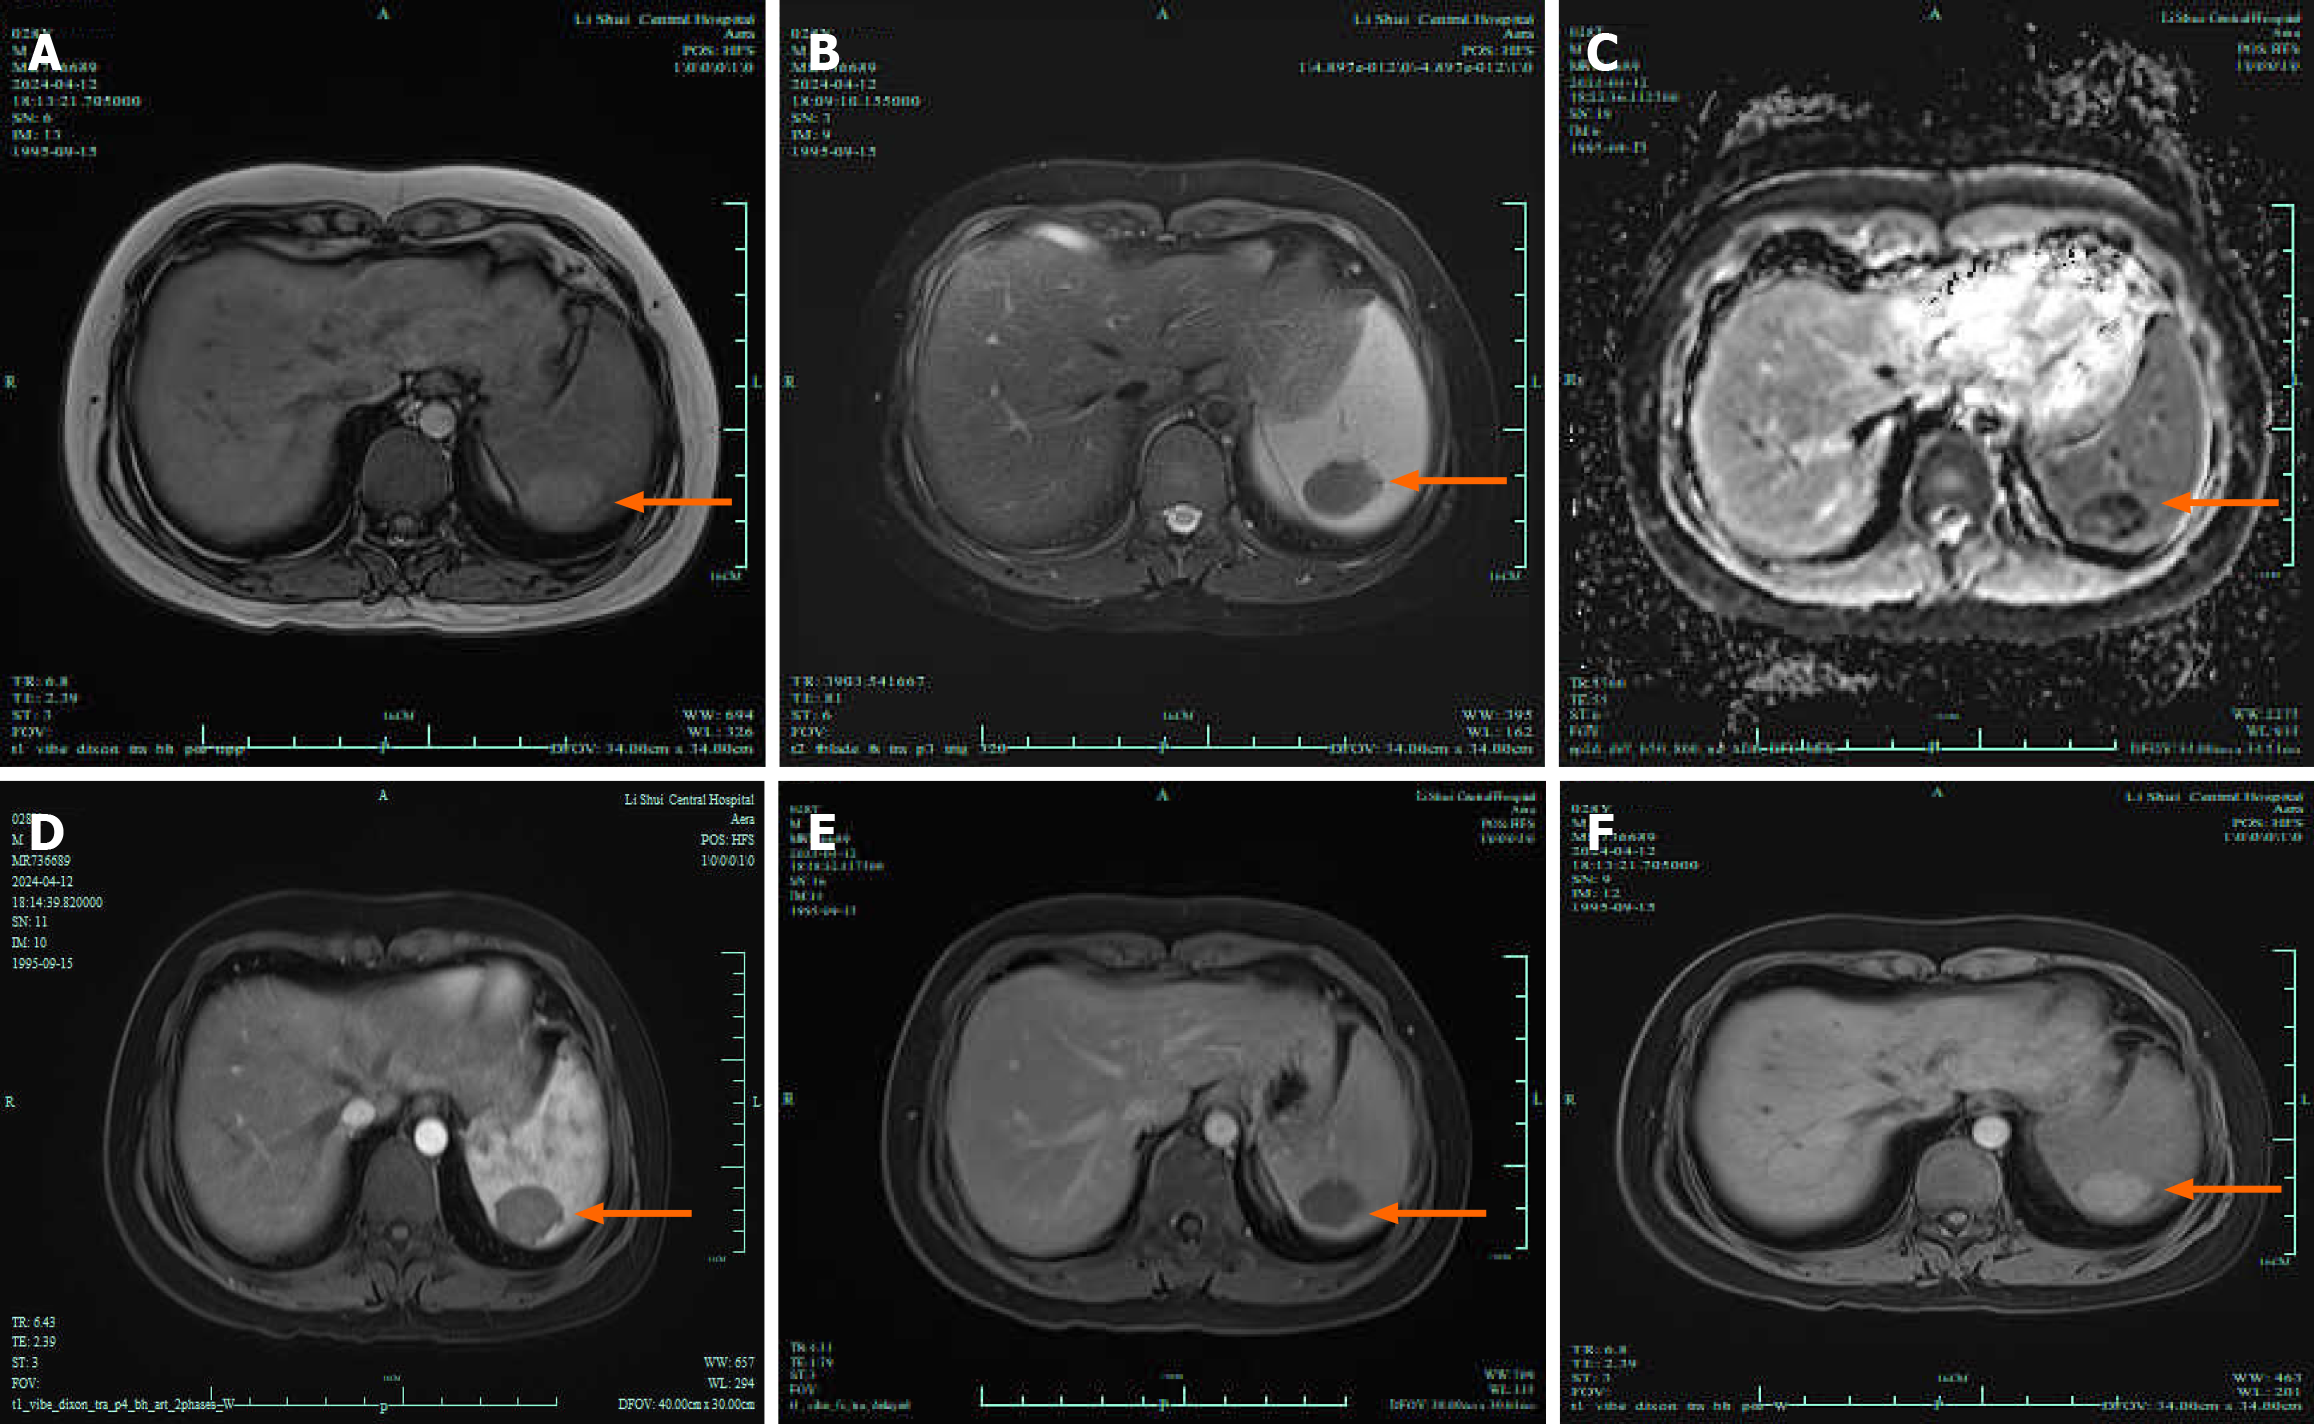
Figure 2 Magnetic resonance imaging sequences: A nodular, mass-like area of abnormal signal intensity measuring approximately 2.
4 cm × 3.5 cm is visible within the spleen. A: T1-weighted imaging shows a heterogeneous, slightly hyperintense signal; B: T2-weighted imaging demonstrates a heterogeneous, hypointense signal with well-defined, smooth margins; C: Diffusion-weighted imaging shows altered diffusion patterns; D-F: No enhancement is observed on contrast-enhanced scans. Orange arrow: Visible lesions.
- Citation: Li ZK, Zhang K, Zhang HL, Lv XL, Guo JQ, Tan W. Splenic tuberculous mass following anti-tuberculosis therapy was misdiagnosed as a splenic tumor: A case report. World J Gastrointest Surg 2026; 18(3): 115137
- URL: https://www.wjgnet.com/1948-9366/full/v18/i3/115137.htm
- DOI: https://dx.doi.org/10.4240/wjgs.v18.i3.115137