
















Copyright: ©Author(s) 2026.
World J Gastrointest Surg. Mar 27, 2026; 18(3): 113773
Published online Mar 27, 2026. doi: 10.4240/wjgs.v18.i3.113773
Published online Mar 27, 2026. doi: 10.4240/wjgs.v18.i3.113773
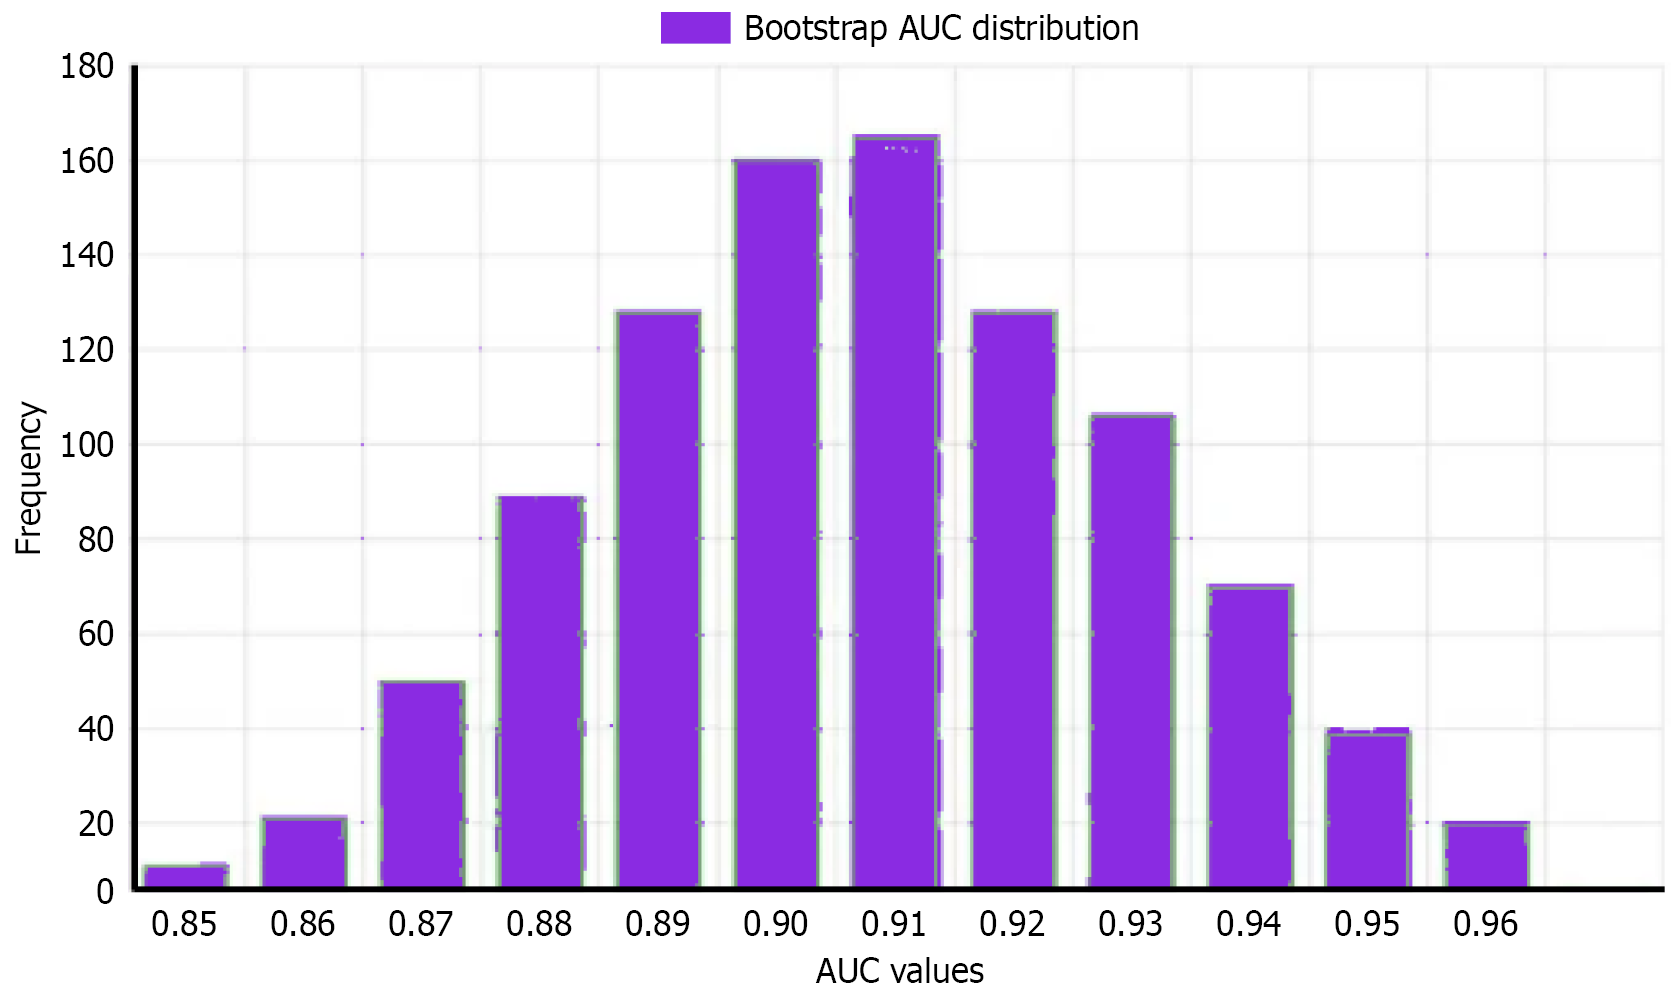
Figure 4 Bootstrap internal validation results (1000 iterations): Distribution of area under the curve values from bootstrap resampling.
The histogram displays the distribution of area under the curve values obtained from 1000 bootstrap resamples. The distribution is approximately normal and centered around 0.90-0.91, with values ranging from 0.85 to 0.97. This internal validation demonstrates the stability and robustness of the model’s discriminative ability, with consistently high area under the curve values across bootstrap iterations confirming reliable predictive performance. AUC: Area under the curve.
- Citation: Yin H, Liu Y, Chen JT, Li Z, Pan Y, Zhu F. Predictive value of serum biochemical indicators combined with imaging scores for prognosis of traumatic liver rupture. World J Gastrointest Surg 2026; 18(3): 113773
- URL: https://www.wjgnet.com/1948-9366/full/v18/i3/113773.htm
- DOI: https://dx.doi.org/10.4240/wjgs.v18.i3.113773