
















Copyright: ©Author(s) 2026.
World J Gastrointest Surg. Mar 27, 2026; 18(3): 113773
Published online Mar 27, 2026. doi: 10.4240/wjgs.v18.i3.113773
Published online Mar 27, 2026. doi: 10.4240/wjgs.v18.i3.113773
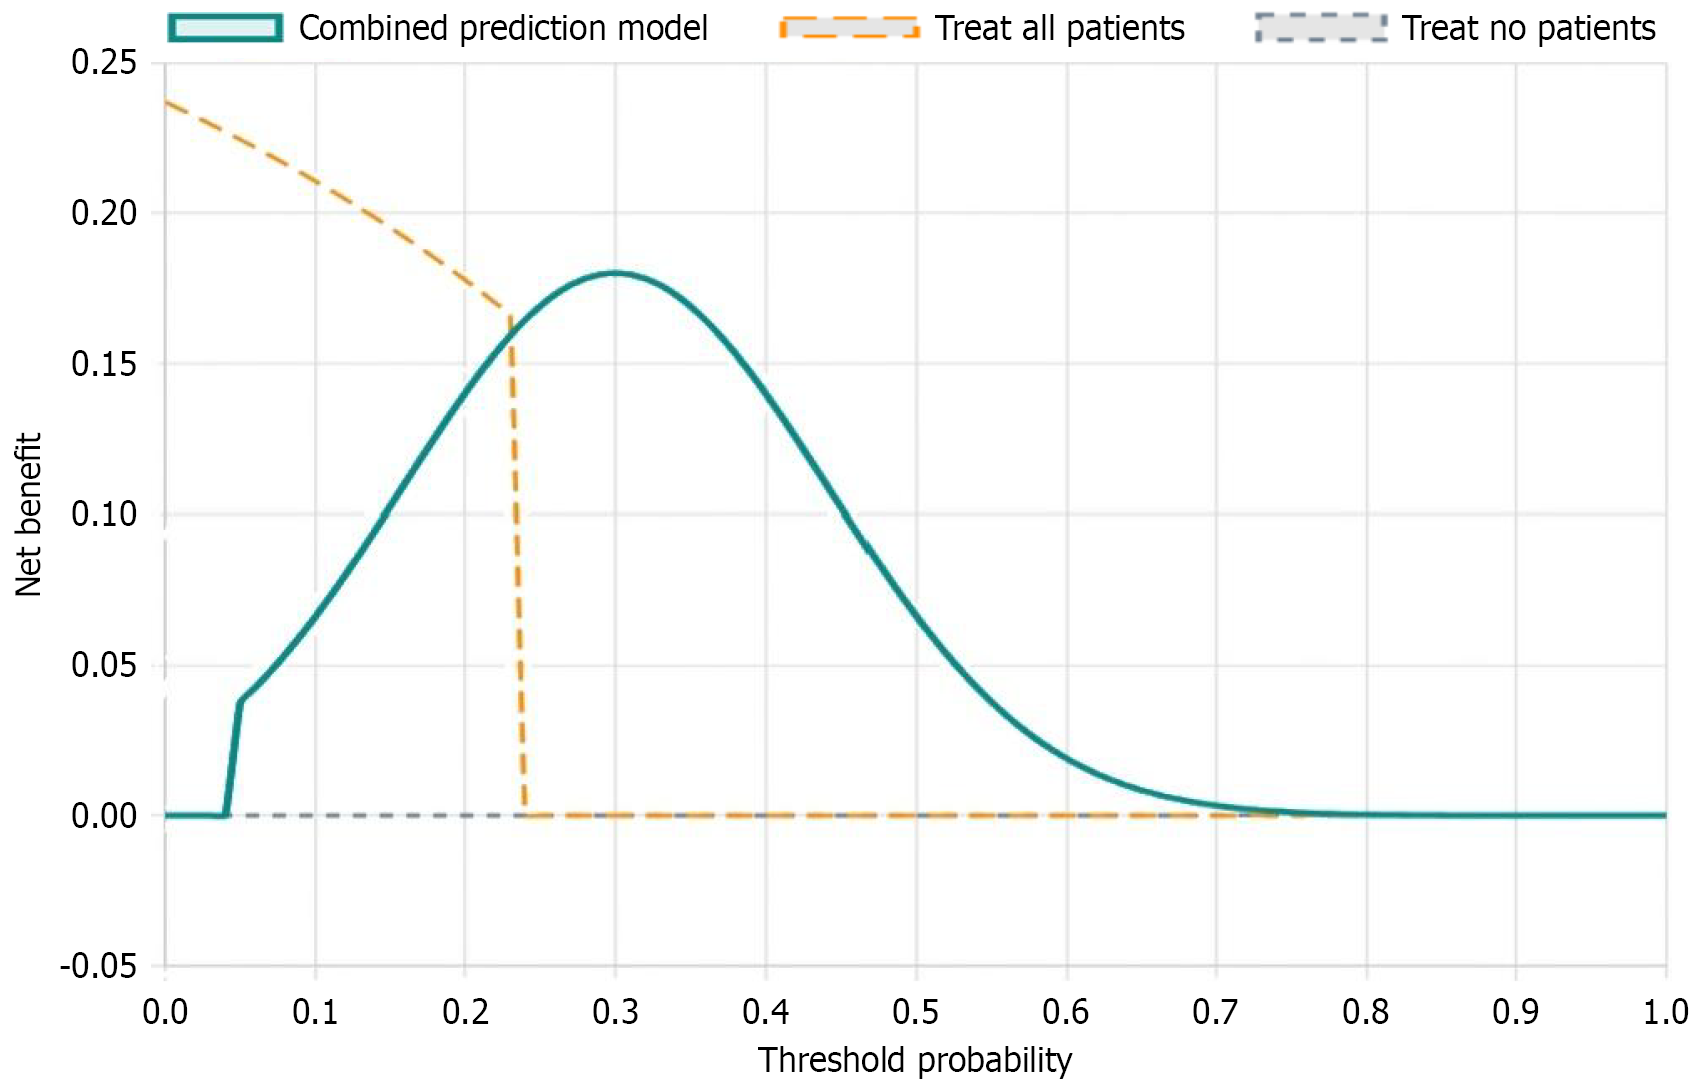
Figure 3 Decision curve analysis of clinical net benefit: Comparison of treatment strategies across threshold probabilities.
The teal curve represents the net benefit (Y-axis) of using the prediction model to guide treatment decisions across different threshold probabilities (X-axis). The orange dashed line shows the strategy of treating all patients, while the gray dashed line represents treating no patients. The model demonstrates positive net benefit compared to both default strategies across threshold probabilities ranging from approximately 0.05 to 0.65, with peak net benefit observed at a threshold probability of about 0.25, indicating substantial clinical value for risk-based decision making.
- Citation: Yin H, Liu Y, Chen JT, Li Z, Pan Y, Zhu F. Predictive value of serum biochemical indicators combined with imaging scores for prognosis of traumatic liver rupture. World J Gastrointest Surg 2026; 18(3): 113773
- URL: https://www.wjgnet.com/1948-9366/full/v18/i3/113773.htm
- DOI: https://dx.doi.org/10.4240/wjgs.v18.i3.113773