
















Copyright: ©Author(s) 2026.
World J Gastrointest Surg. Mar 27, 2026; 18(3): 113773
Published online Mar 27, 2026. doi: 10.4240/wjgs.v18.i3.113773
Published online Mar 27, 2026. doi: 10.4240/wjgs.v18.i3.113773
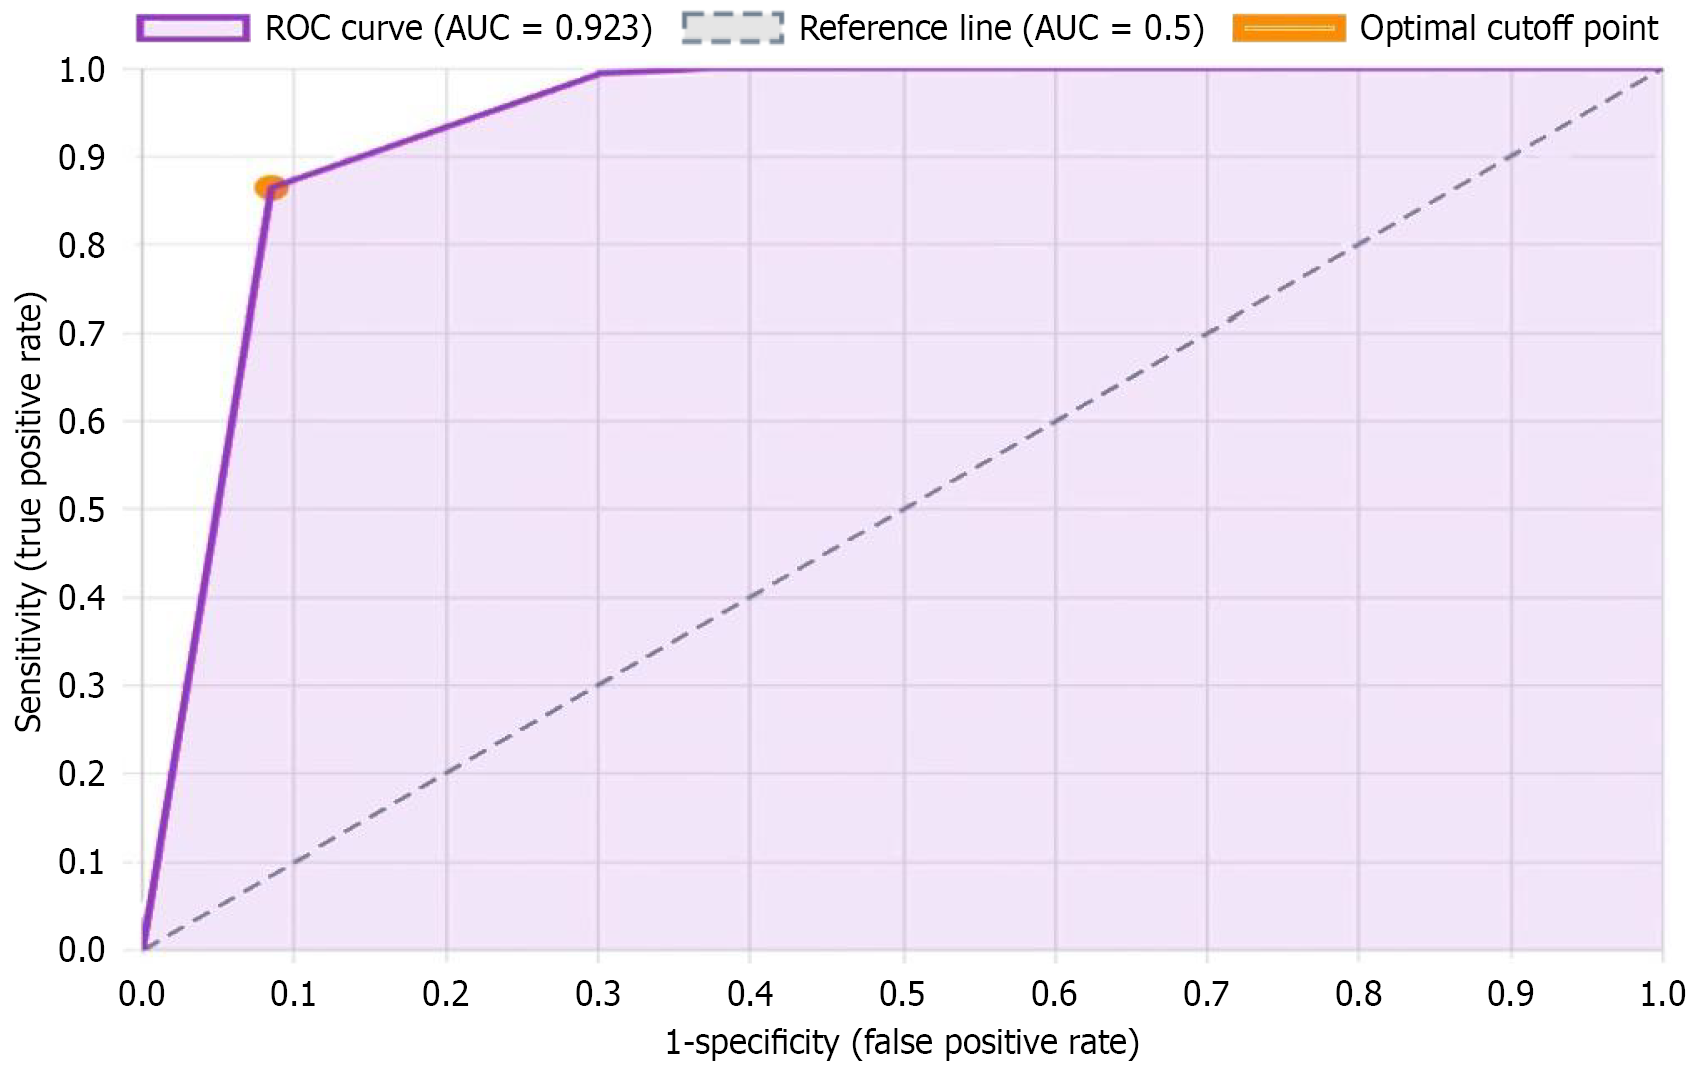
Figure 2 Receiver operating characteristic curve of the combined prediction model: Diagnostic performance analysis.
The purple curve demonstrates model discrimination performance with an area under the curve of 0.923, indicating excellent predictive accuracy. The diagonal dashed line represents random chance (area under the curve = 0.5). The orange point marks the optimal cutoff threshold that maximizes the balance between sensitivity (true positive rate, Y-axis) and specificity (1 minus false positive rate, X-axis) for clinical risk classification. ROC: Receiver operating characteristic; AUC: Area under the curve.
- Citation: Yin H, Liu Y, Chen JT, Li Z, Pan Y, Zhu F. Predictive value of serum biochemical indicators combined with imaging scores for prognosis of traumatic liver rupture. World J Gastrointest Surg 2026; 18(3): 113773
- URL: https://www.wjgnet.com/1948-9366/full/v18/i3/113773.htm
- DOI: https://dx.doi.org/10.4240/wjgs.v18.i3.113773