
















Copyright: ©Author(s) 2026.
World J Gastrointest Surg. Mar 27, 2026; 18(3): 113773
Published online Mar 27, 2026. doi: 10.4240/wjgs.v18.i3.113773
Published online Mar 27, 2026. doi: 10.4240/wjgs.v18.i3.113773
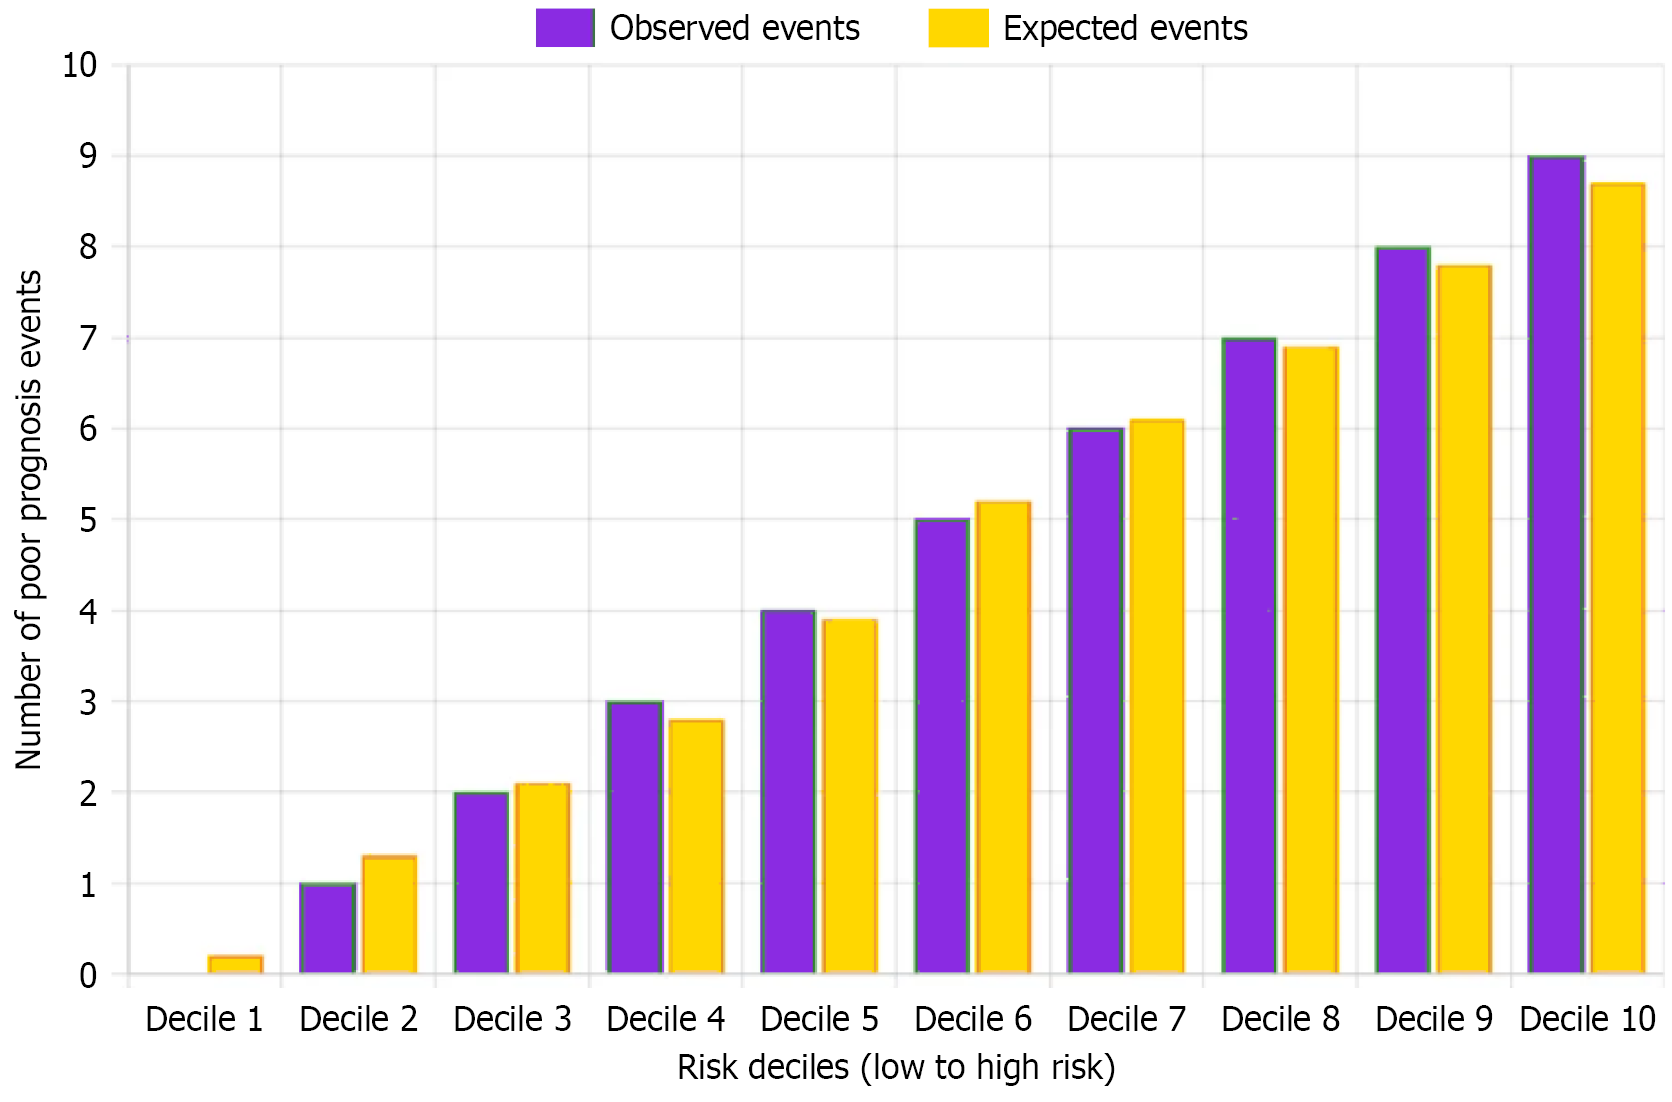
Figure 1 Hosmer-Lemeshow goodness-of-fit test for model calibration: Comparison of observed vs expected events across risk deciles.
The bar chart displays the number of new psoriasis events (Y-axis) stratified by predicted risk deciles from lowest (decile 1) to highest (decile 10) risk. Green bars represent observed events while orange bars represent expected events based on the prediction model. The plot demonstrates good calibration, with observed and expected events closely aligned across all risk strata, and a clear risk gradient showing increasing event rates from low-risk to high-risk deciles.
- Citation: Yin H, Liu Y, Chen JT, Li Z, Pan Y, Zhu F. Predictive value of serum biochemical indicators combined with imaging scores for prognosis of traumatic liver rupture. World J Gastrointest Surg 2026; 18(3): 113773
- URL: https://www.wjgnet.com/1948-9366/full/v18/i3/113773.htm
- DOI: https://dx.doi.org/10.4240/wjgs.v18.i3.113773