
















Copyright: ©Author(s) 2026.
World J Gastrointest Surg. Mar 27, 2026; 18(3): 112405
Published online Mar 27, 2026. doi: 10.4240/wjgs.v18.i3.112405
Published online Mar 27, 2026. doi: 10.4240/wjgs.v18.i3.112405
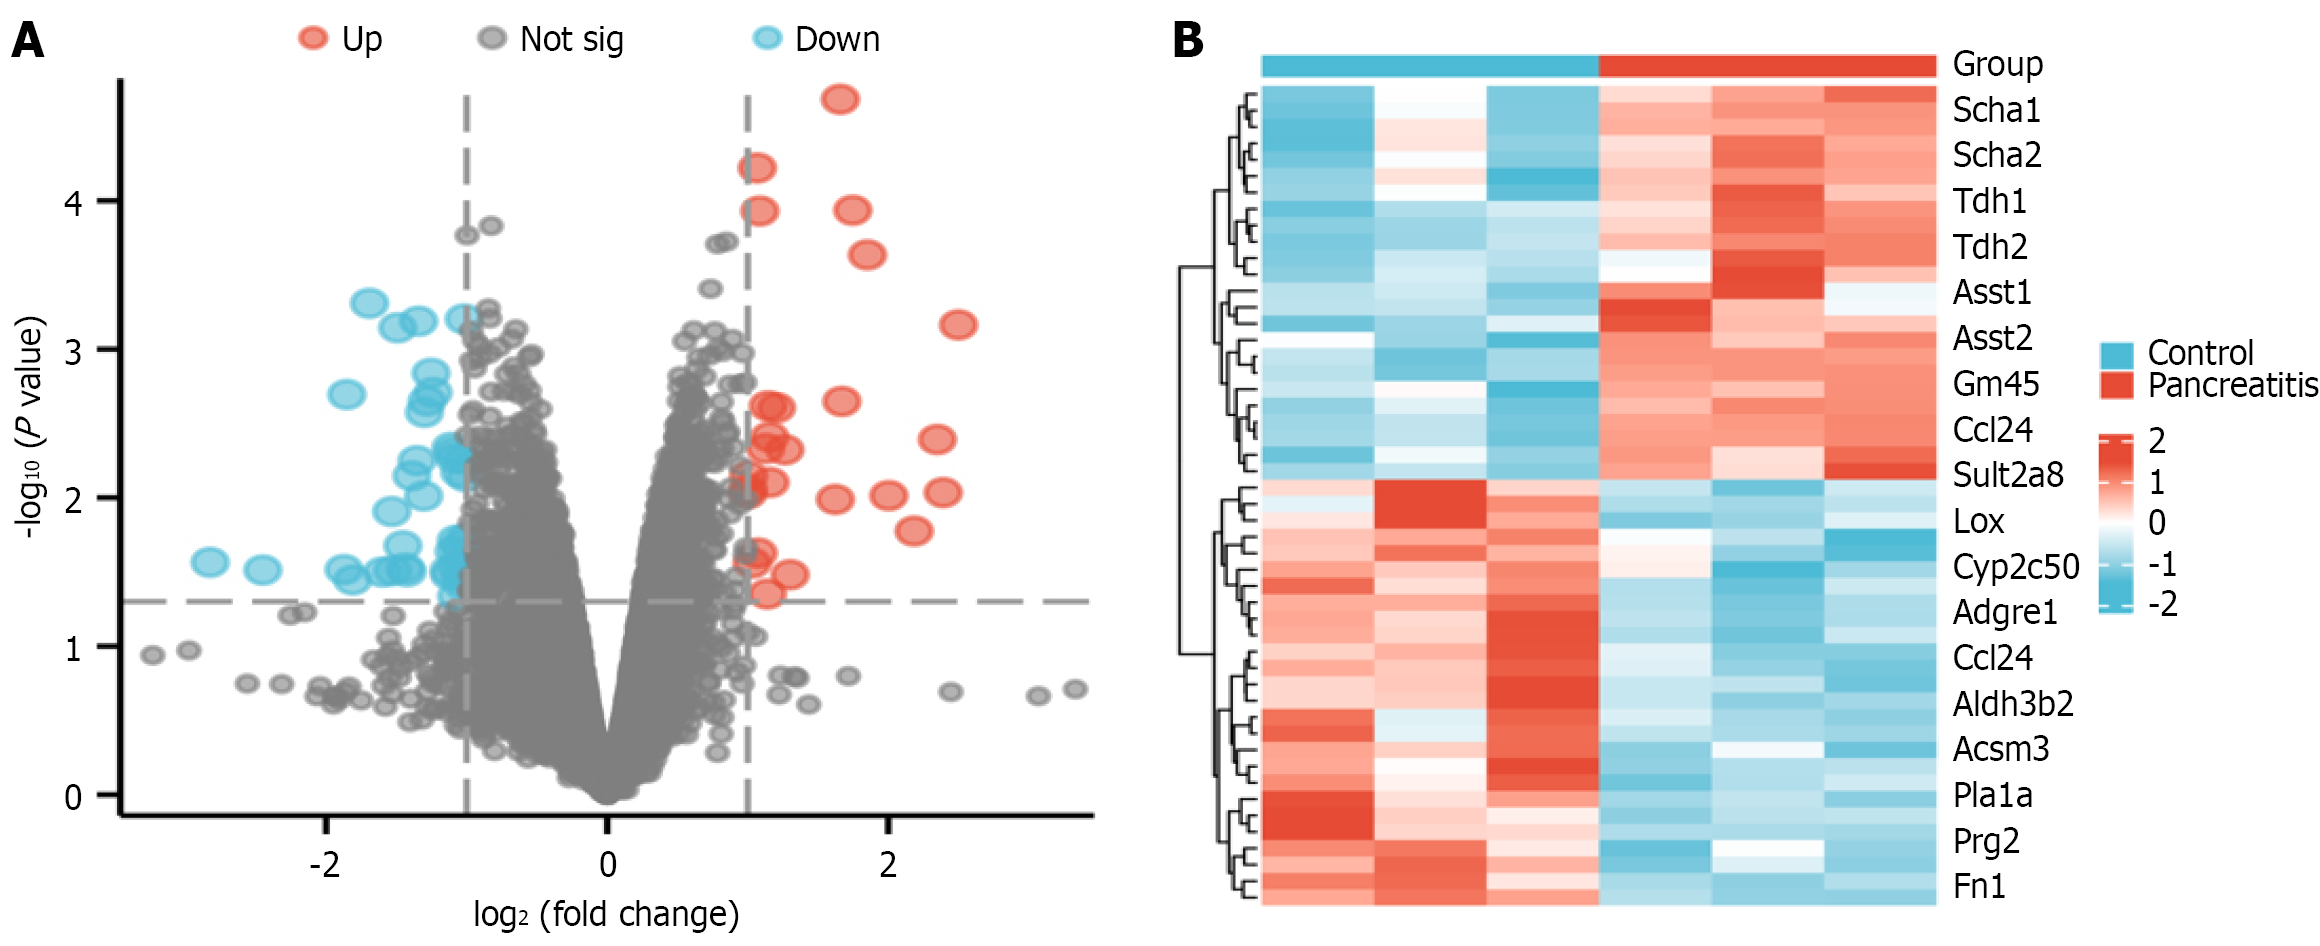
Figure 1 Illustrates the data processing and identification of differentially expressed genes.
A: A heatmap displaying the sample-to-sample correlation. The diabetes group displayed a stronger intra-group correlation compared to the control group; B: A volcano plot generated using the limma R tool, showcasing all the differentially expressed genes in both the control and diabetes groups.
- Citation: Zheng L, Wang J, Xu MQ, Jiang W, Qian L, Ge Y, Feng MK, Zhu YM, Wang MJ, Sun SS, Liu CK, Wang XM, Zhang C. Dachengqitang mitigates endoscopic retrograde cholangiopancreatography-induced pancreatitis. World J Gastrointest Surg 2026; 18(3): 112405
- URL: https://www.wjgnet.com/1948-9366/full/v18/i3/112405.htm
- DOI: https://dx.doi.org/10.4240/wjgs.v18.i3.112405