
















©Author(s) (or their employer(s)) 2026.
World J Gastrointest Surg. Feb 27, 2026; 18(2): 115427
Published online Feb 27, 2026. doi: 10.4240/wjgs.v18.i2.115427
Published online Feb 27, 2026. doi: 10.4240/wjgs.v18.i2.115427
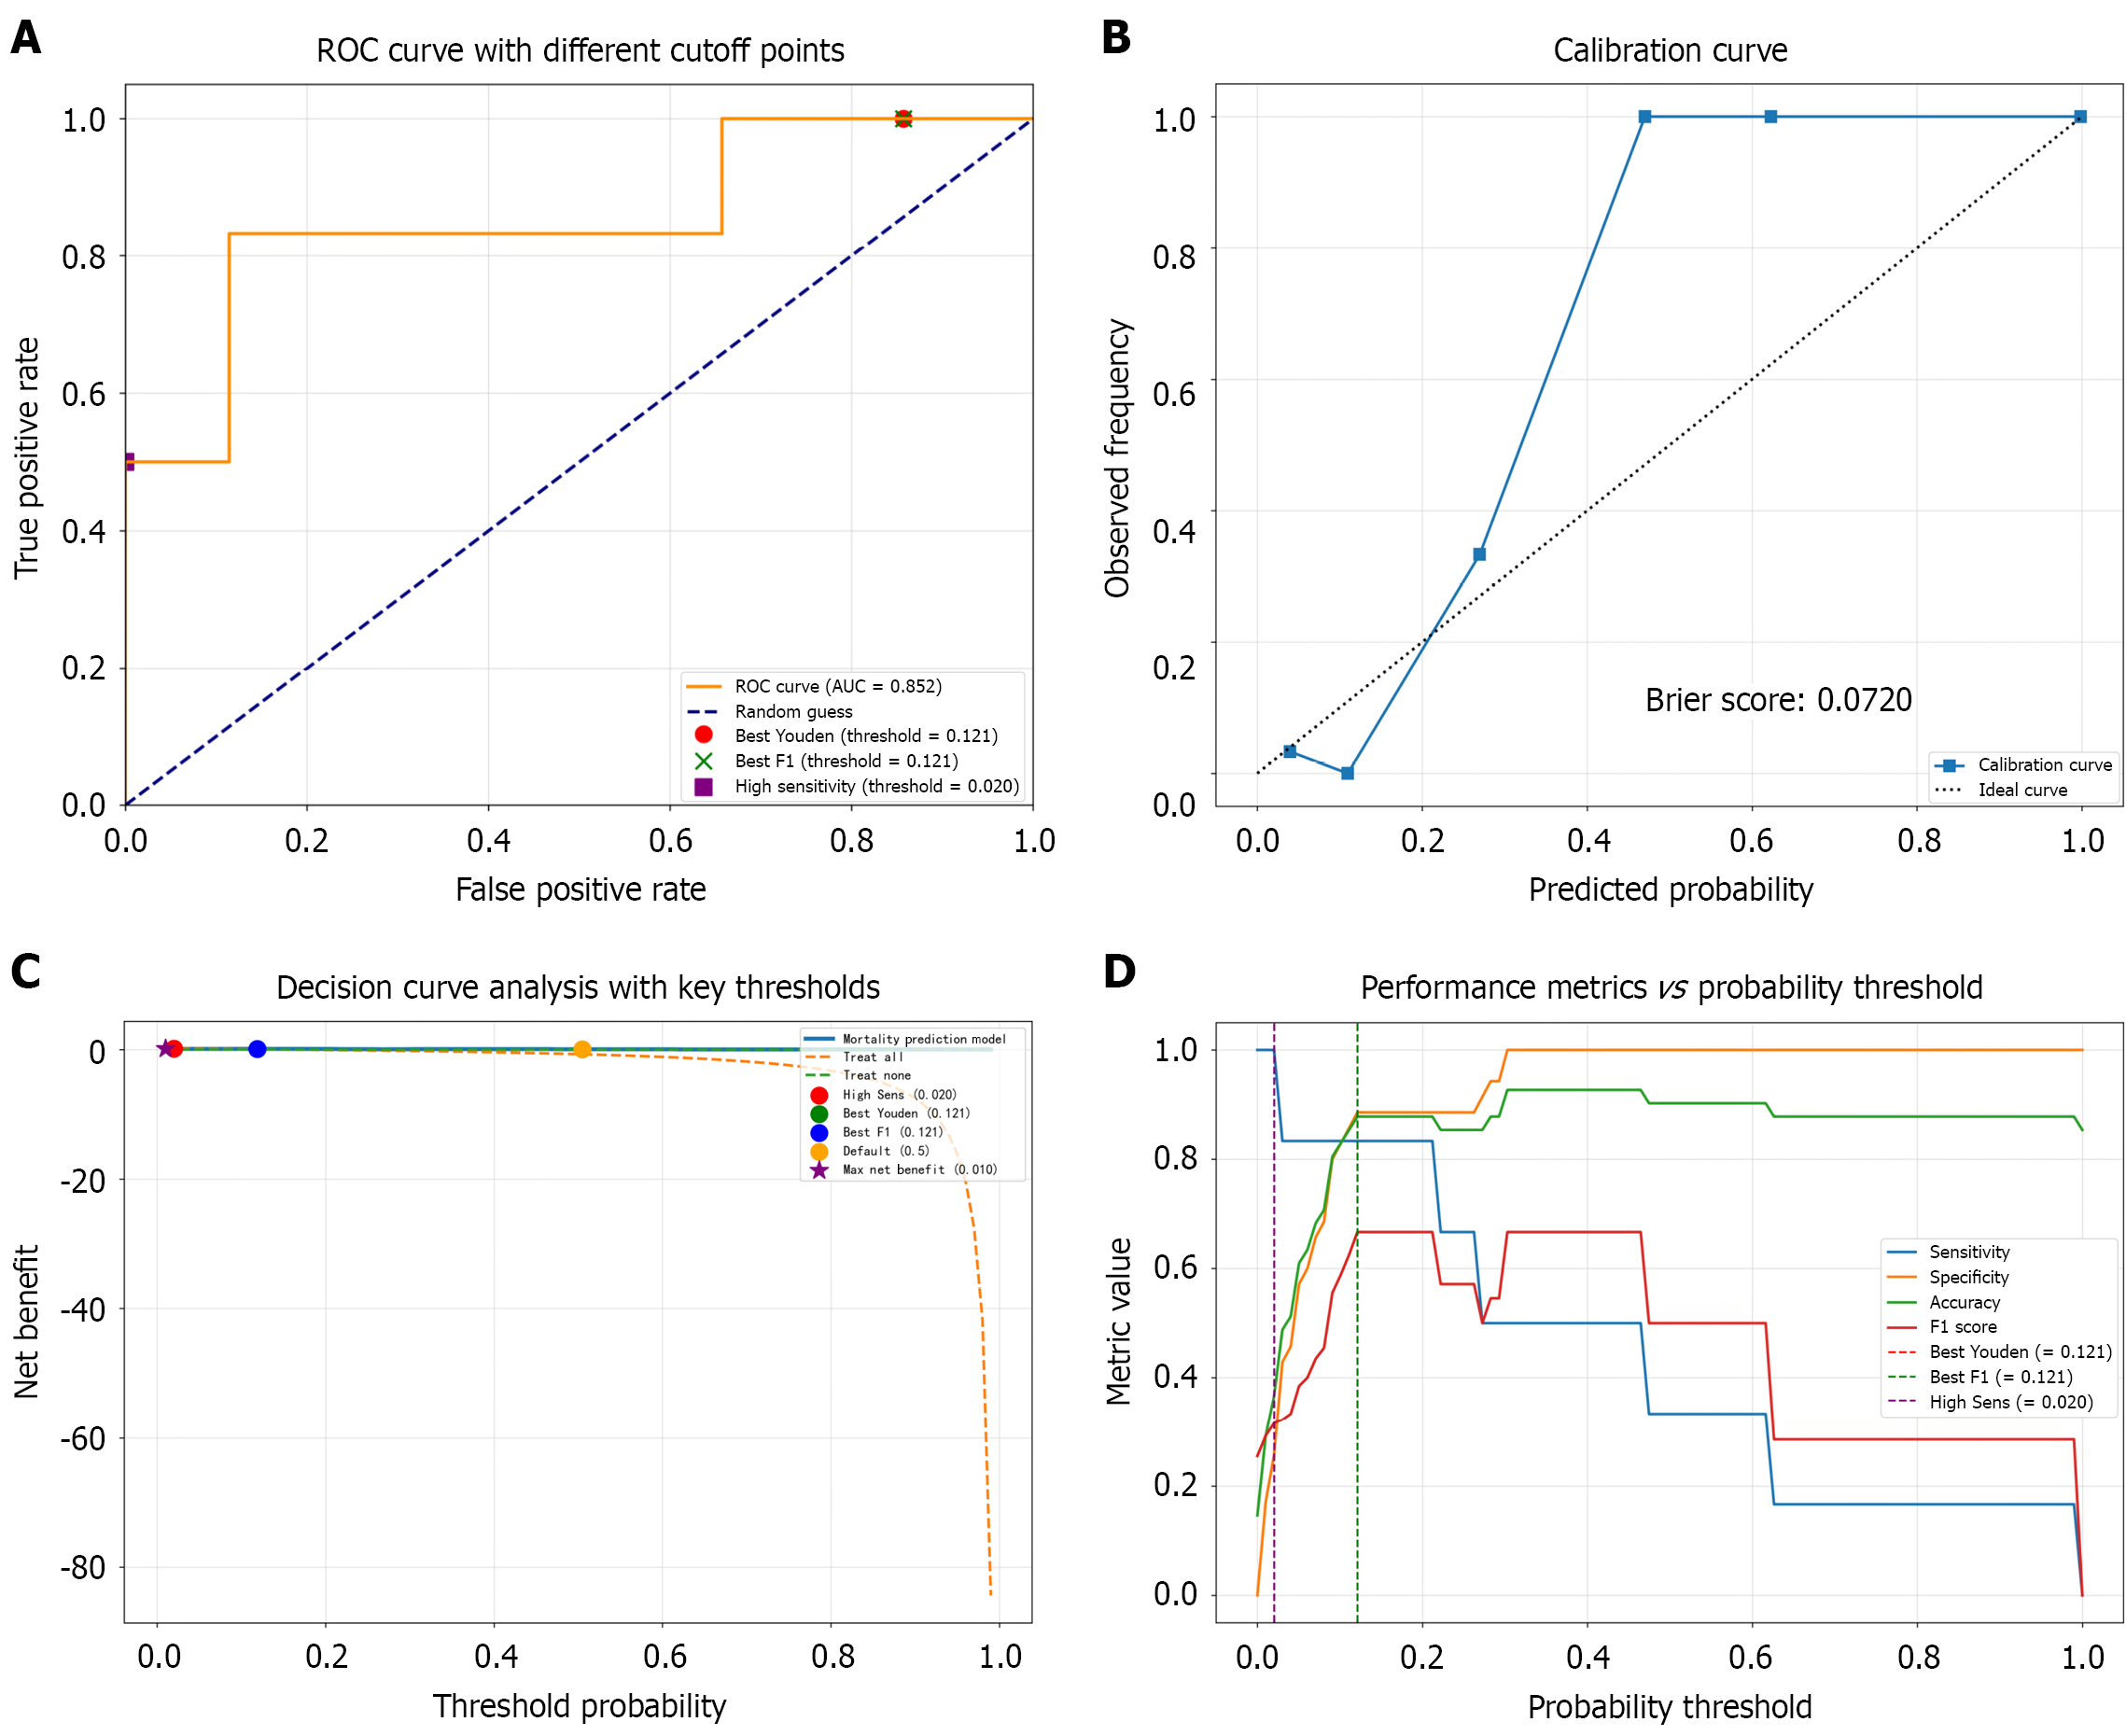
Figure 2 Model performance.
A: Receiver operating characteristic curve of the four-variable nomogram. The area under the curve (AUC) value was 0.852 (95% confidence interval: 0.791-0.913), indicating excellent discrimination for 30-day mortality; B: Calibration plot comparing predicted vs observed mortality probabilities. The dashed 45° line represents perfect calibration; the solid line represents the model-based fit. A Brier score = 0.072 and slope ≈ 1 indicate high agreement across the entire risk range, supporting direct clinical use without further probability recalibration; C: Decision curve analysis. Decision curve for the nomogram across clinically relevant threshold probabilities (1%-40%). The net benefit of the model exceeds that of the “treat-all” (orange dashed) and “treat-none” (green dashed) strategies over the entire range, confirming clinical utility; D: Threshold sensitivity plot. Sensitivity, specificity, accuracy and F1 score vs probability threshold. The vertical dotted lines mark the two selected cut-offs: 0.020 (high-sensitivity screen) and 0.121 (optimal Youden/F1 point), supporting the dual-threshold funnel strategy. ROC: Receiver operating characteristic.
- Citation: Xu XJ, Zhang HD, Cheng CJ, Zhang YM, Zhang Q. Risk factor analysis and nomogram model construction for mortality in patients following colonic perforation surgery. World J Gastrointest Surg 2026; 18(2): 115427
- URL: https://www.wjgnet.com/1948-9366/full/v18/i2/115427.htm
- DOI: https://dx.doi.org/10.4240/wjgs.v18.i2.115427