
















©Author(s) (or their employer(s)) 2026.
World J Gastrointest Surg. Feb 27, 2026; 18(2): 114951
Published online Feb 27, 2026. doi: 10.4240/wjgs.v18.i2.114951
Published online Feb 27, 2026. doi: 10.4240/wjgs.v18.i2.114951
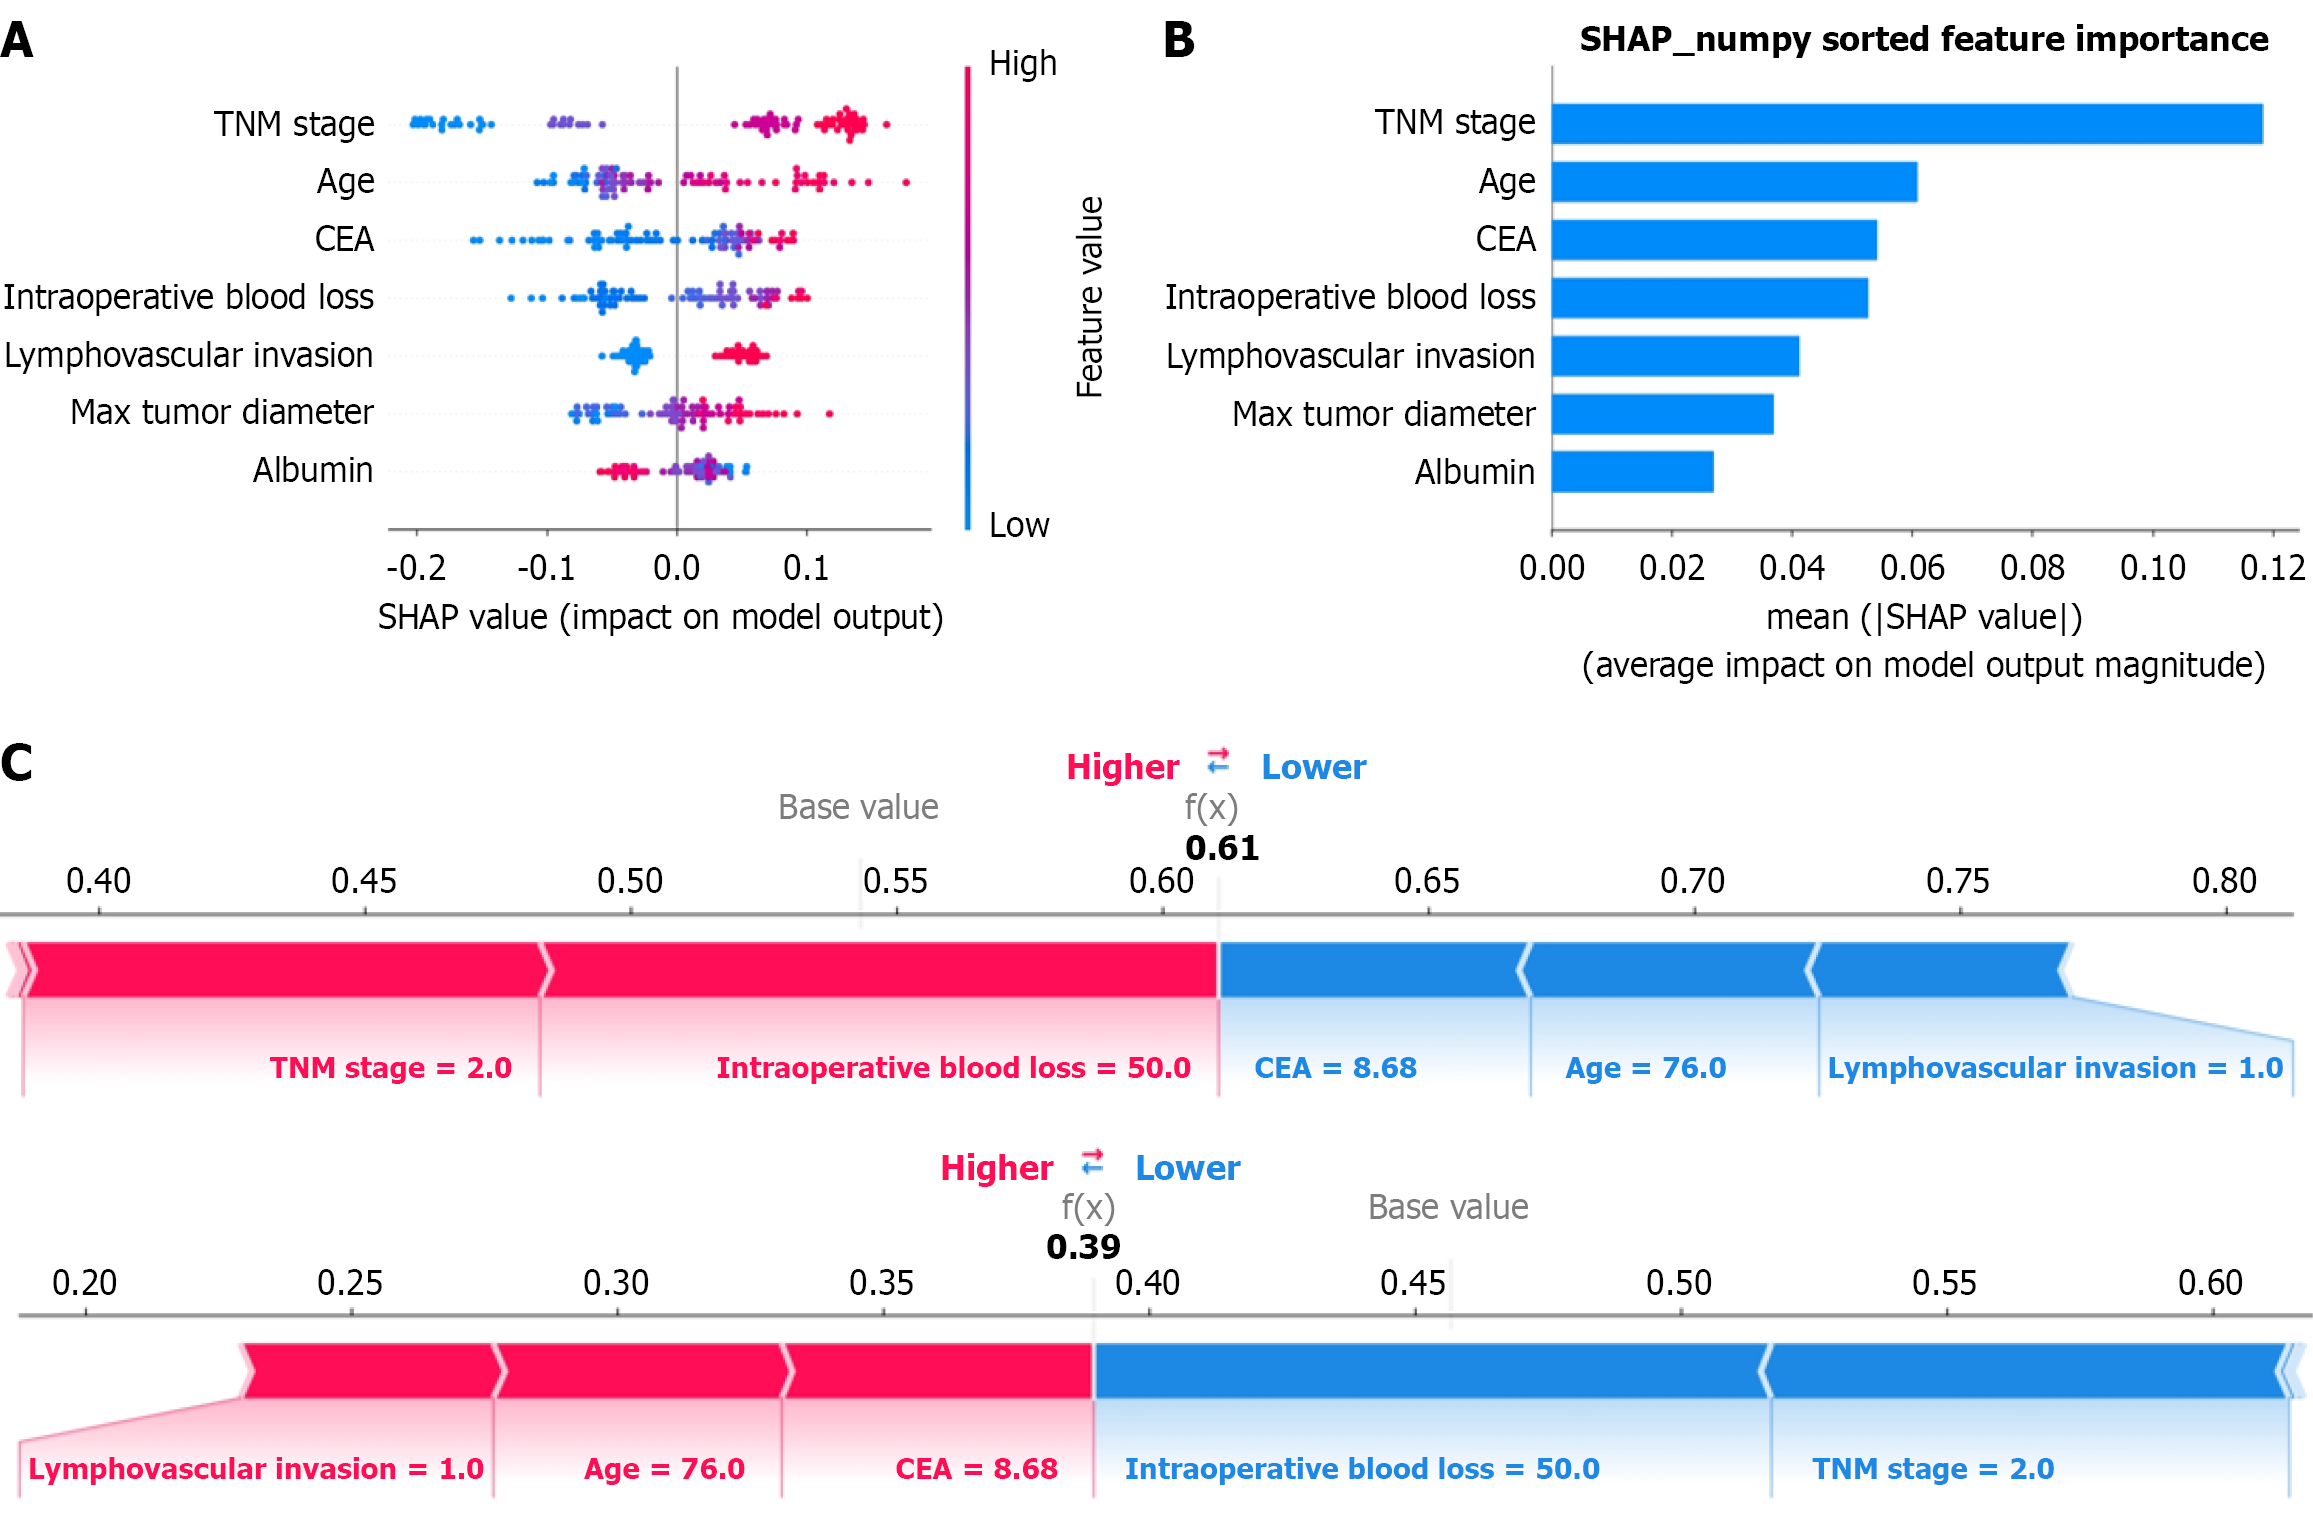
Figure 4 SHapley Additive exPlanations analysis for the optimal extra trees model.
A: Beeswarm plot summarizing feature impacts across the dataset; B: Ranking of feature importance based on mean absolute SHapley Additive exPlanations values for the extremely randomized trees model; C: Force plot illustrating the explanation for an individual prediction. TNM: Tumor-node-metastasis; CEA: Carcinoembryonic antigen; SHAP: SHapley Additive exPlanations.
- Citation: Lü YN, Liu D, Tao S, Wu J, Yu SJ, Yuan HL. Development of a machine learning-based model for predicting postoperative survival in gastric cancer. World J Gastrointest Surg 2026; 18(2): 114951
- URL: https://www.wjgnet.com/1948-9366/full/v18/i2/114951.htm
- DOI: https://dx.doi.org/10.4240/wjgs.v18.i2.114951