
















©Author(s) (or their employer(s)) 2026.
World J Gastrointest Surg. Feb 27, 2026; 18(2): 114378
Published online Feb 27, 2026. doi: 10.4240/wjgs.v18.i2.114378
Published online Feb 27, 2026. doi: 10.4240/wjgs.v18.i2.114378
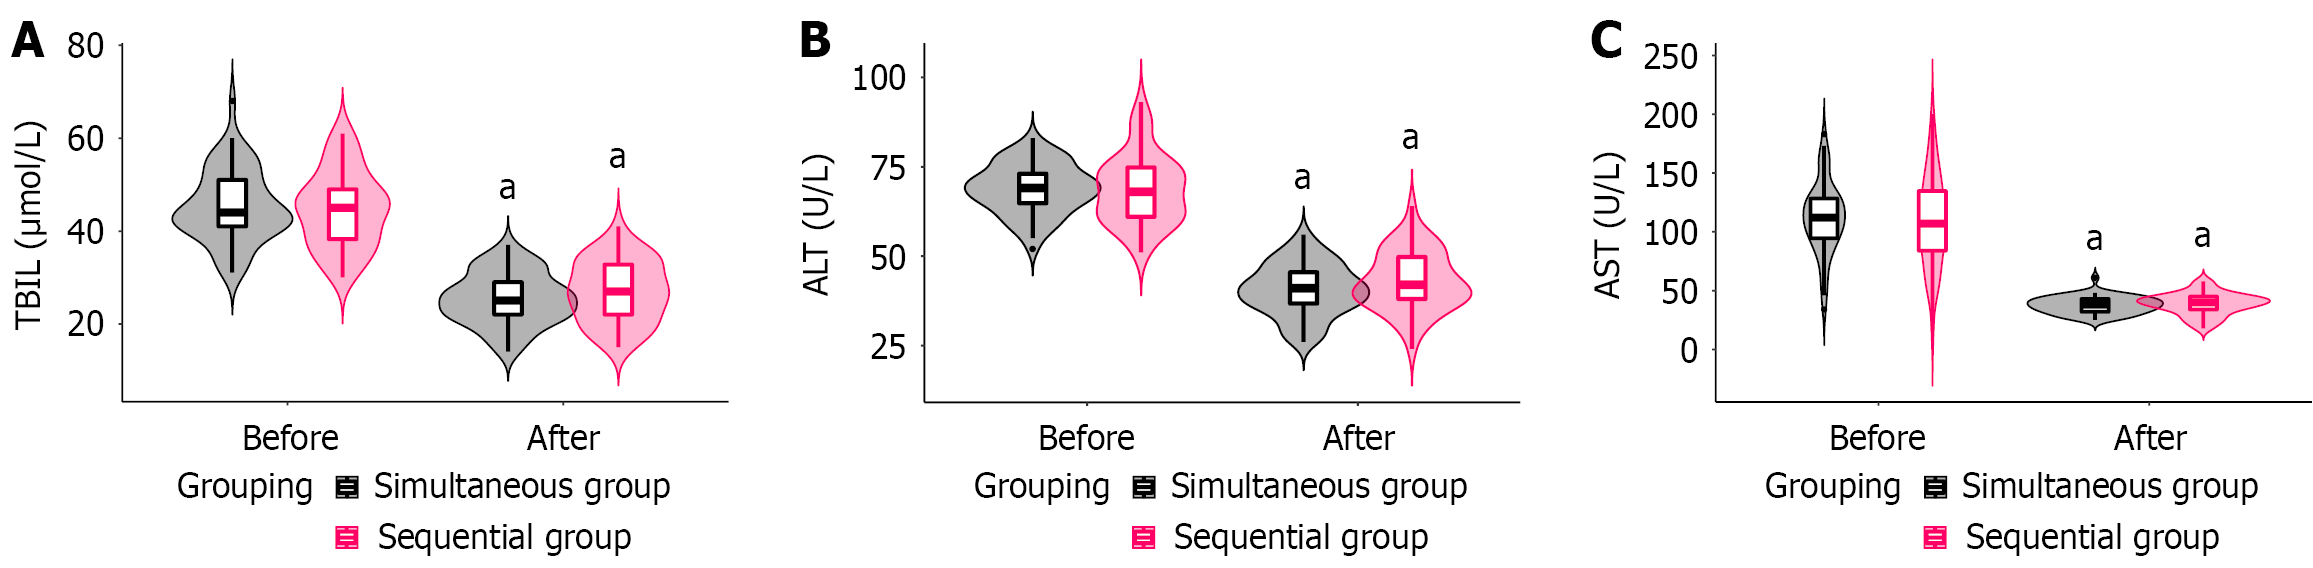
Figure 4 Comparative assessment of liver function indices.
A: Comparison of pre- and post-treatment total bilirubin; B: Pre- and post-treatment alanine aminotransferase variations across cohorts; C: Aspartate aminotransferase levels prior to and following therapy. TBIL: Total bilirubin; ALT: Alanine aminotransferase; AST: Aspartate aminotransferase. aP < 0.01 vs pre-treatment values.
- Citation: Yu Y, Yuan W, Lei J, Zhao CB, Tao CG, Liu SH, Wang BL. Synchronous vs sequential combination of transarterial chemoembolization and microwave ablation for hepatocellular carcinoma: Efficacy and prognosis. World J Gastrointest Surg 2026; 18(2): 114378
- URL: https://www.wjgnet.com/1948-9366/full/v18/i2/114378.htm
- DOI: https://dx.doi.org/10.4240/wjgs.v18.i2.114378