
















©Author(s) (or their employer(s)) 2026.
World J Gastrointest Surg. Feb 27, 2026; 18(2): 113979
Published online Feb 27, 2026. doi: 10.4240/wjgs.v18.i2.113979
Published online Feb 27, 2026. doi: 10.4240/wjgs.v18.i2.113979
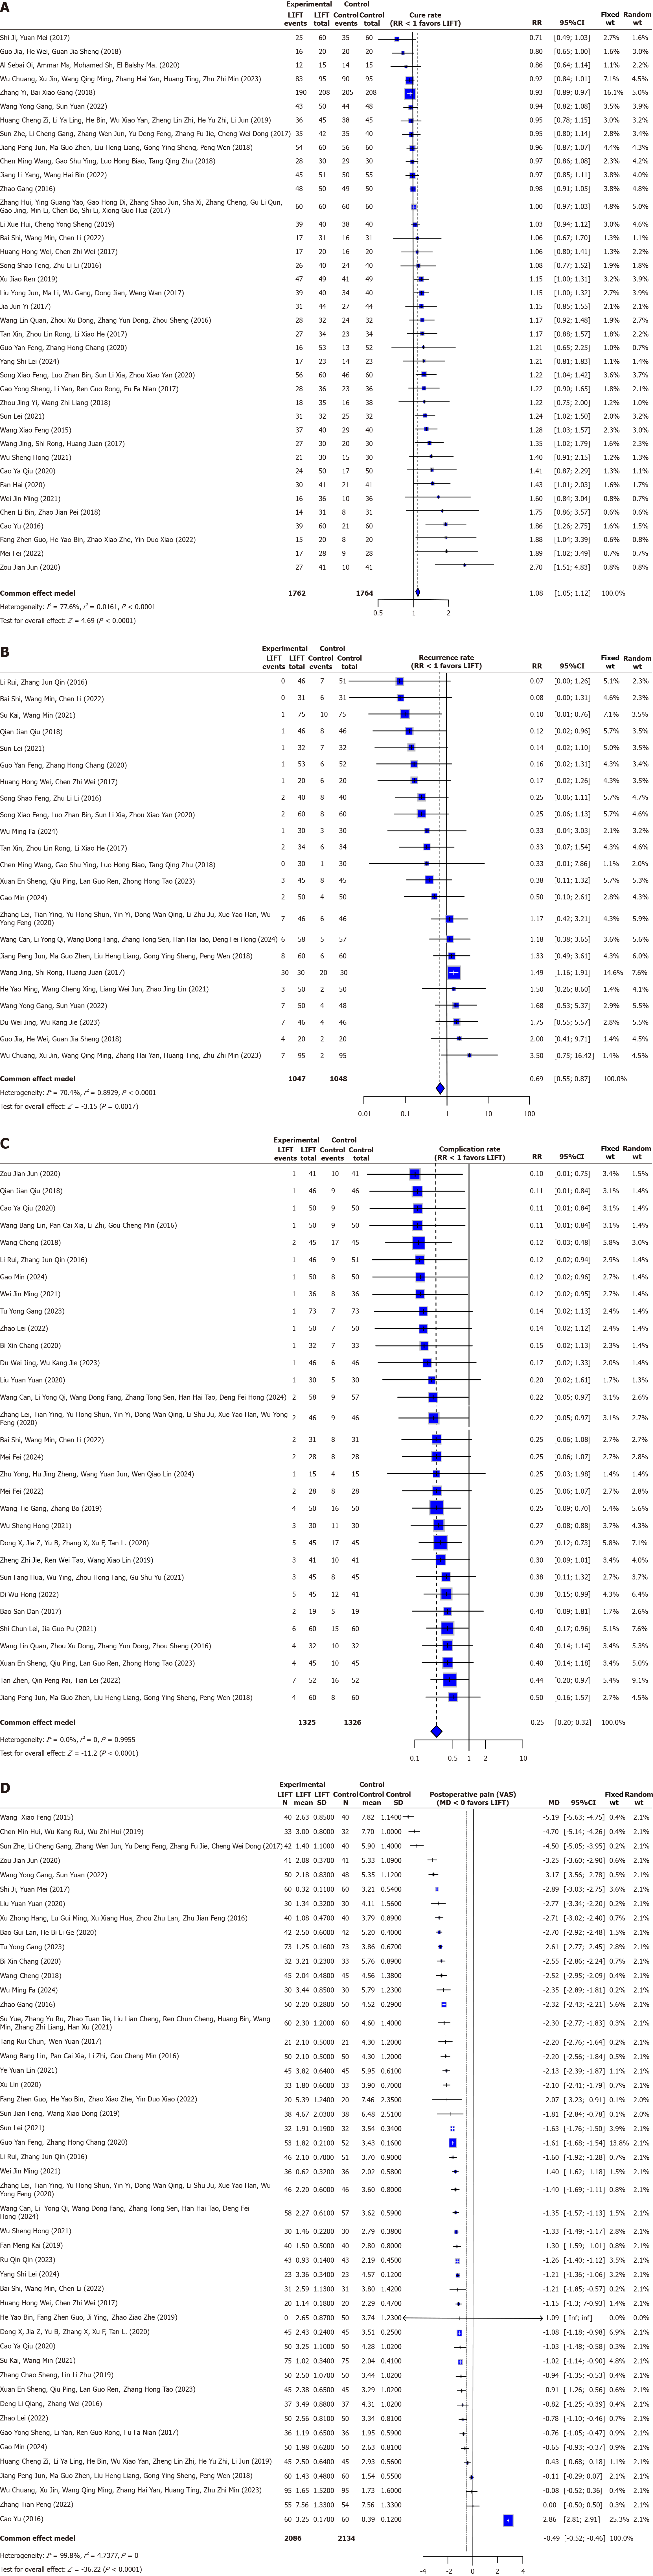
Figure 2 Forest plot.
A: Cure rate. Forest plot depicting pooled relative risk (RR) of cure following ligation of the intersphincteric fistula tract (LIFT) vs conventional surgery, with 95% confidence intervals (CIs). Each square represents an individual study estimate, and the diamond indicates the overall pooled effect; B: Recurrence rate. Forest plot depicting the pooled RR for recurrence between LIFT and conventional surgery, with 95%CIs. A lower RR indicates reduced recurrence in the LIFT group; C: Complication rate. Forest plot comparing the complication rates between LIFT and conventional surgery. The pooled RR and 95%CIs demonstrate the safety profile of LIFT; D: Postoperative pain. Forest plot of pooled mean differences in the postoperative pain scores (Visual Analog Scale) between LIFT and conventional surgery, with 95%CIs. Negative values favor LIFT. LIFT: Ligation of the intersphincteric fistula tract; CI: Confidence intervals; RR: Relative risk.
- Citation: Li X, Zhi CC, Wang XL, Zheng LH, Cheng YC. Ligation of the intersphincteric fistula tract vs conventional surgery for anal fistula in Chinese patients. World J Gastrointest Surg 2026; 18(2): 113979
- URL: https://www.wjgnet.com/1948-9366/full/v18/i2/113979.htm
- DOI: https://dx.doi.org/10.4240/wjgs.v18.i2.113979