
















©Author(s) (or their employer(s)) 2026.
World J Gastrointest Surg. Feb 27, 2026; 18(2): 113530
Published online Feb 27, 2026. doi: 10.4240/wjgs.v18.i2.113530
Published online Feb 27, 2026. doi: 10.4240/wjgs.v18.i2.113530
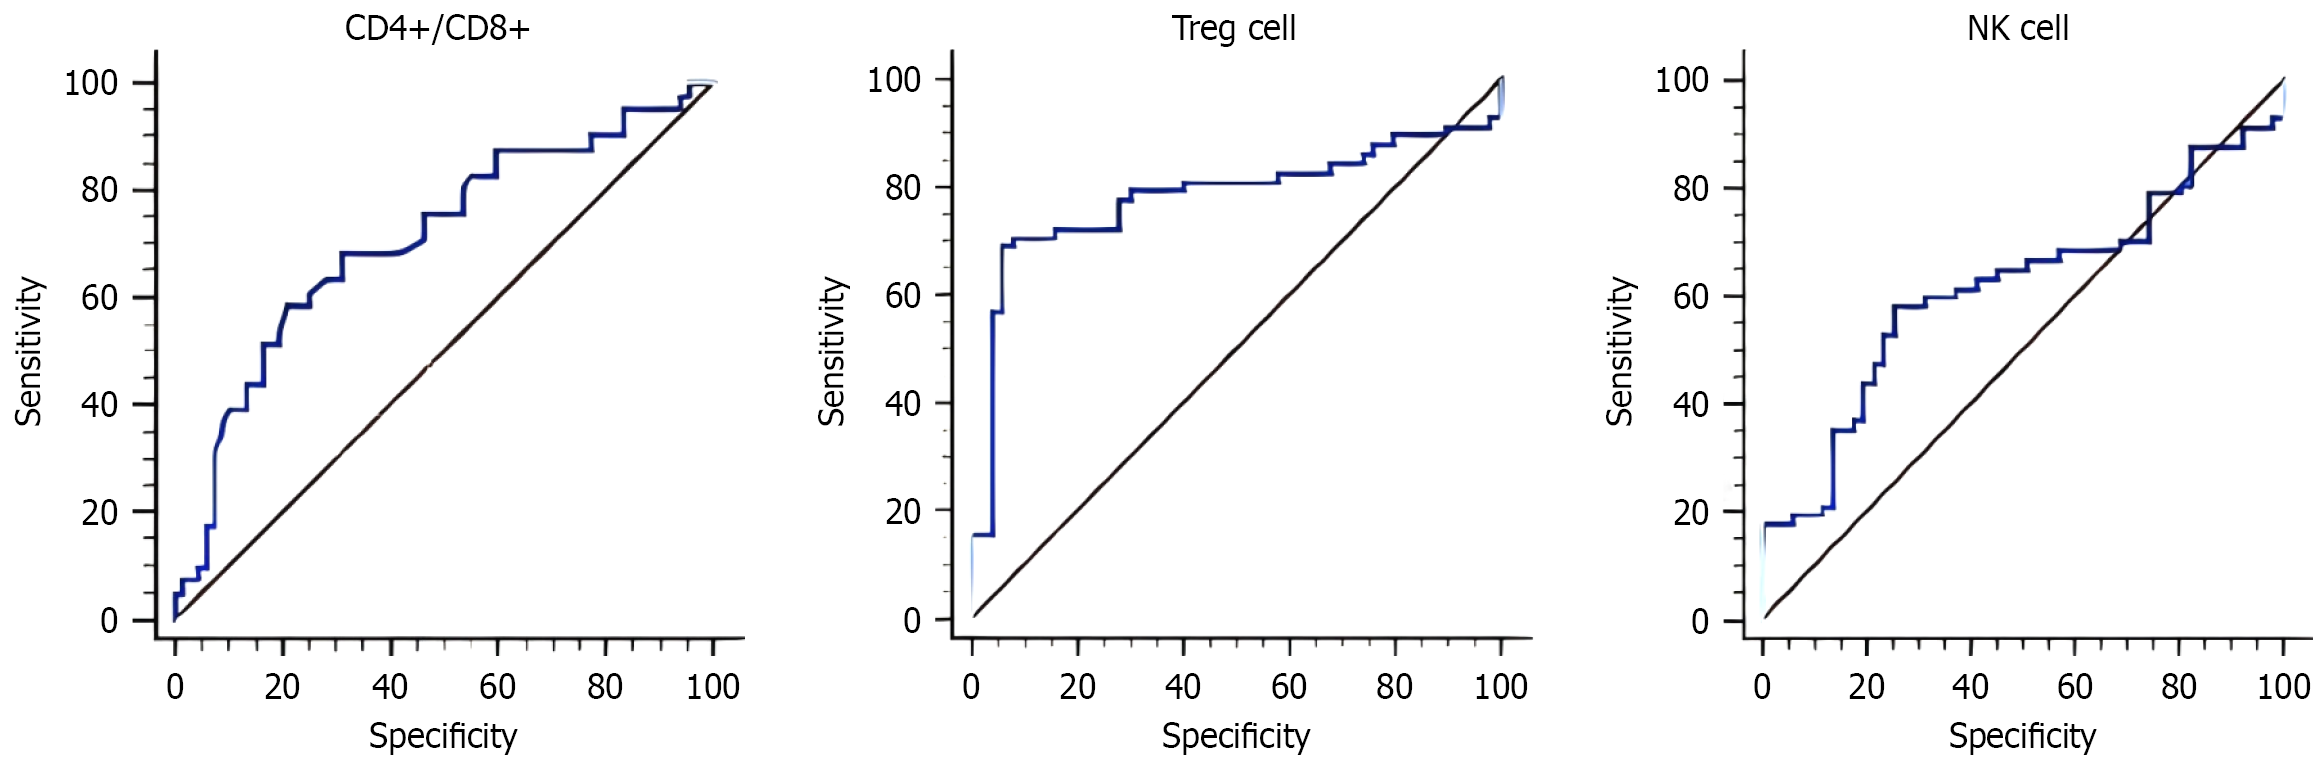
Figure 3 Receiver operating characteristic curve analysis of immune indicators and overall survival.
Receiver operating characteristic curves evaluating the predictive performance of immune cell infiltration levels. Three receiver operating characteristic curves are shown for CD4+/CD8+ T cell ratio, Treg cells, and natural killer cells in predicting patient outcomes or risk stratification. The diagonal reference line represents random chance (area under the curve = 0.5). The curves demonstrate the sensitivity (true positive rate, Y-axis) vs specificity (false positive rate, X-axis) across different threshold values. The deviation of each curve from the diagonal line indicates the discriminatory power of the respective immune cell marker in the prediction model. NK: Natural killer.
- Citation: Yang HJ, Liu B. Spatial immune cell architecture after gastric cancer surgery predicts prognosis. World J Gastrointest Surg 2026; 18(2): 113530
- URL: https://www.wjgnet.com/1948-9366/full/v18/i2/113530.htm
- DOI: https://dx.doi.org/10.4240/wjgs.v18.i2.113530