
















©Author(s) (or their employer(s)) 2026.
World J Gastrointest Surg. Feb 27, 2026; 18(2): 113530
Published online Feb 27, 2026. doi: 10.4240/wjgs.v18.i2.113530
Published online Feb 27, 2026. doi: 10.4240/wjgs.v18.i2.113530
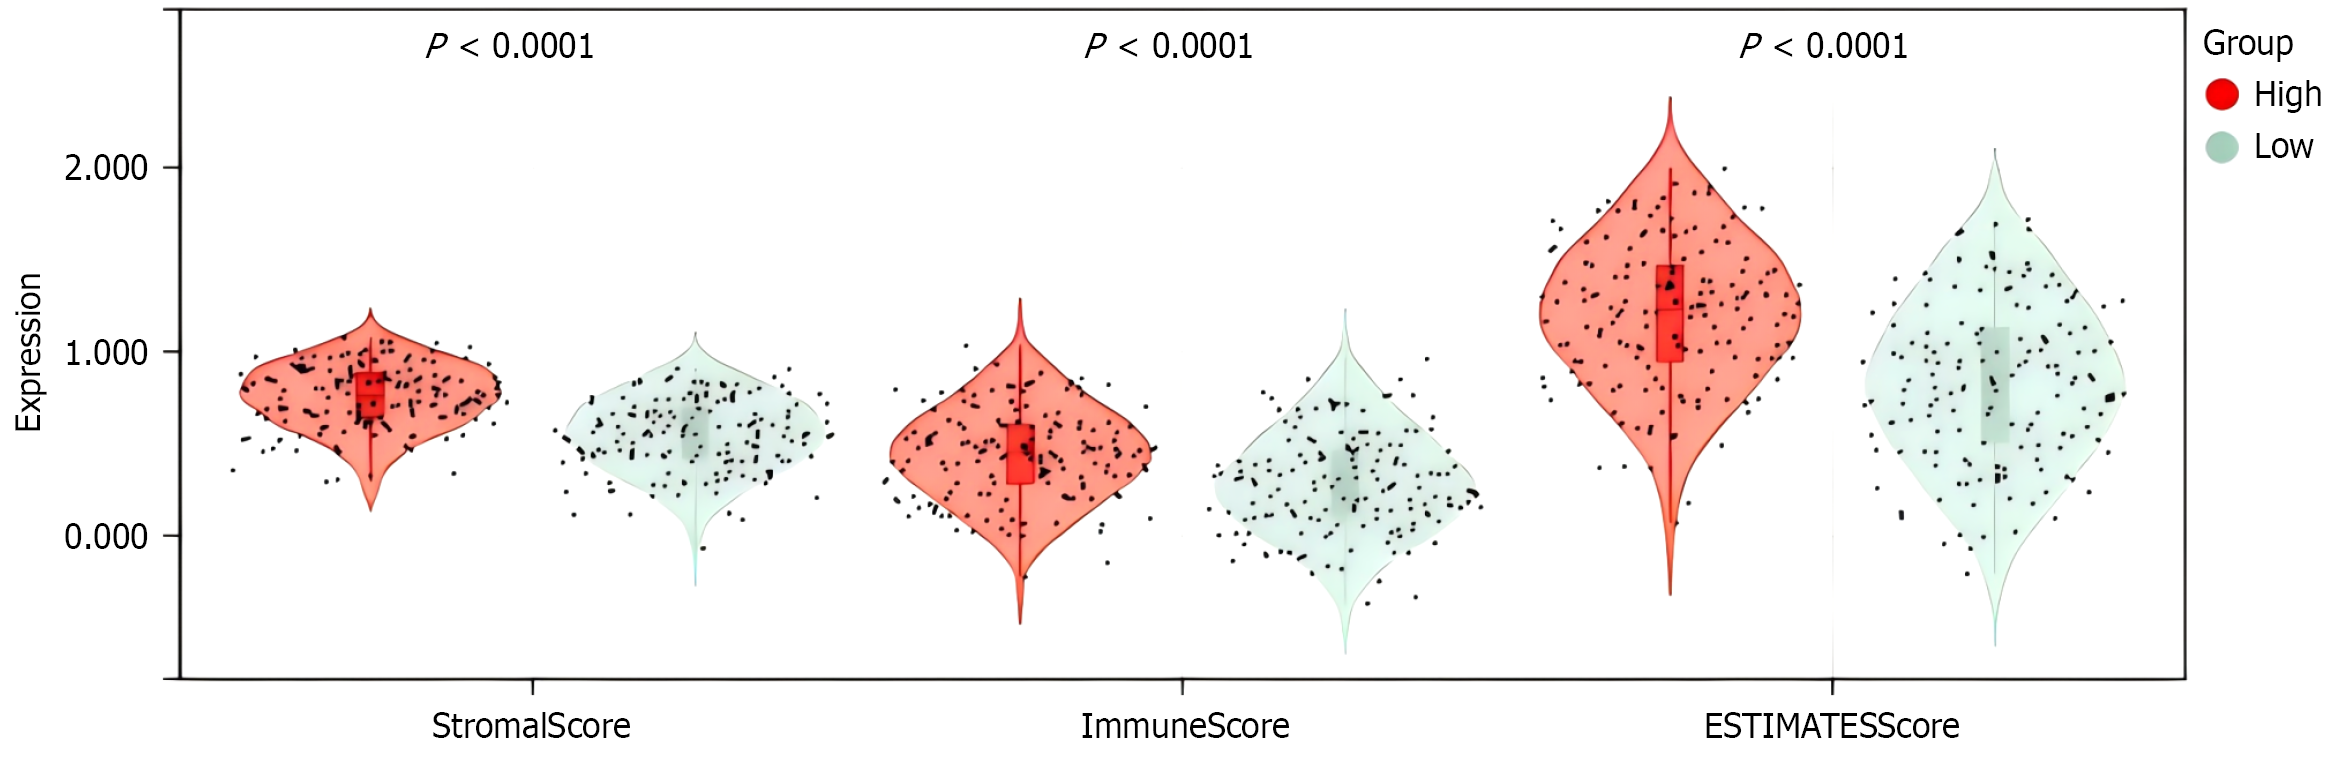
Figure 2 High-risk and low-risk groups and immune infiltration of various immune cells.
Comparison of tumor microenvironment scores between high-risk and low-risk groups. Violin plots showing the distribution differences between the high-risk group (red) and low-risk group (green) across three scoring metrics: StromalScore, ImmuneScore, and ESTIMATEScore. All three scores showed statistically significant differences between the two groups (P < 0.0001), with the high-risk group exhibiting significantly higher stromal infiltration, immune infiltration, and overall tumor microenvironment scores compared to the low-risk group. The violin shapes display the distribution density of the data, with internal scatter points representing the actual score values for individual samples.
- Citation: Yang HJ, Liu B. Spatial immune cell architecture after gastric cancer surgery predicts prognosis. World J Gastrointest Surg 2026; 18(2): 113530
- URL: https://www.wjgnet.com/1948-9366/full/v18/i2/113530.htm
- DOI: https://dx.doi.org/10.4240/wjgs.v18.i2.113530