
















©Author(s) (or their employer(s)) 2026.
World J Gastrointest Surg. Feb 27, 2026; 18(2): 113530
Published online Feb 27, 2026. doi: 10.4240/wjgs.v18.i2.113530
Published online Feb 27, 2026. doi: 10.4240/wjgs.v18.i2.113530
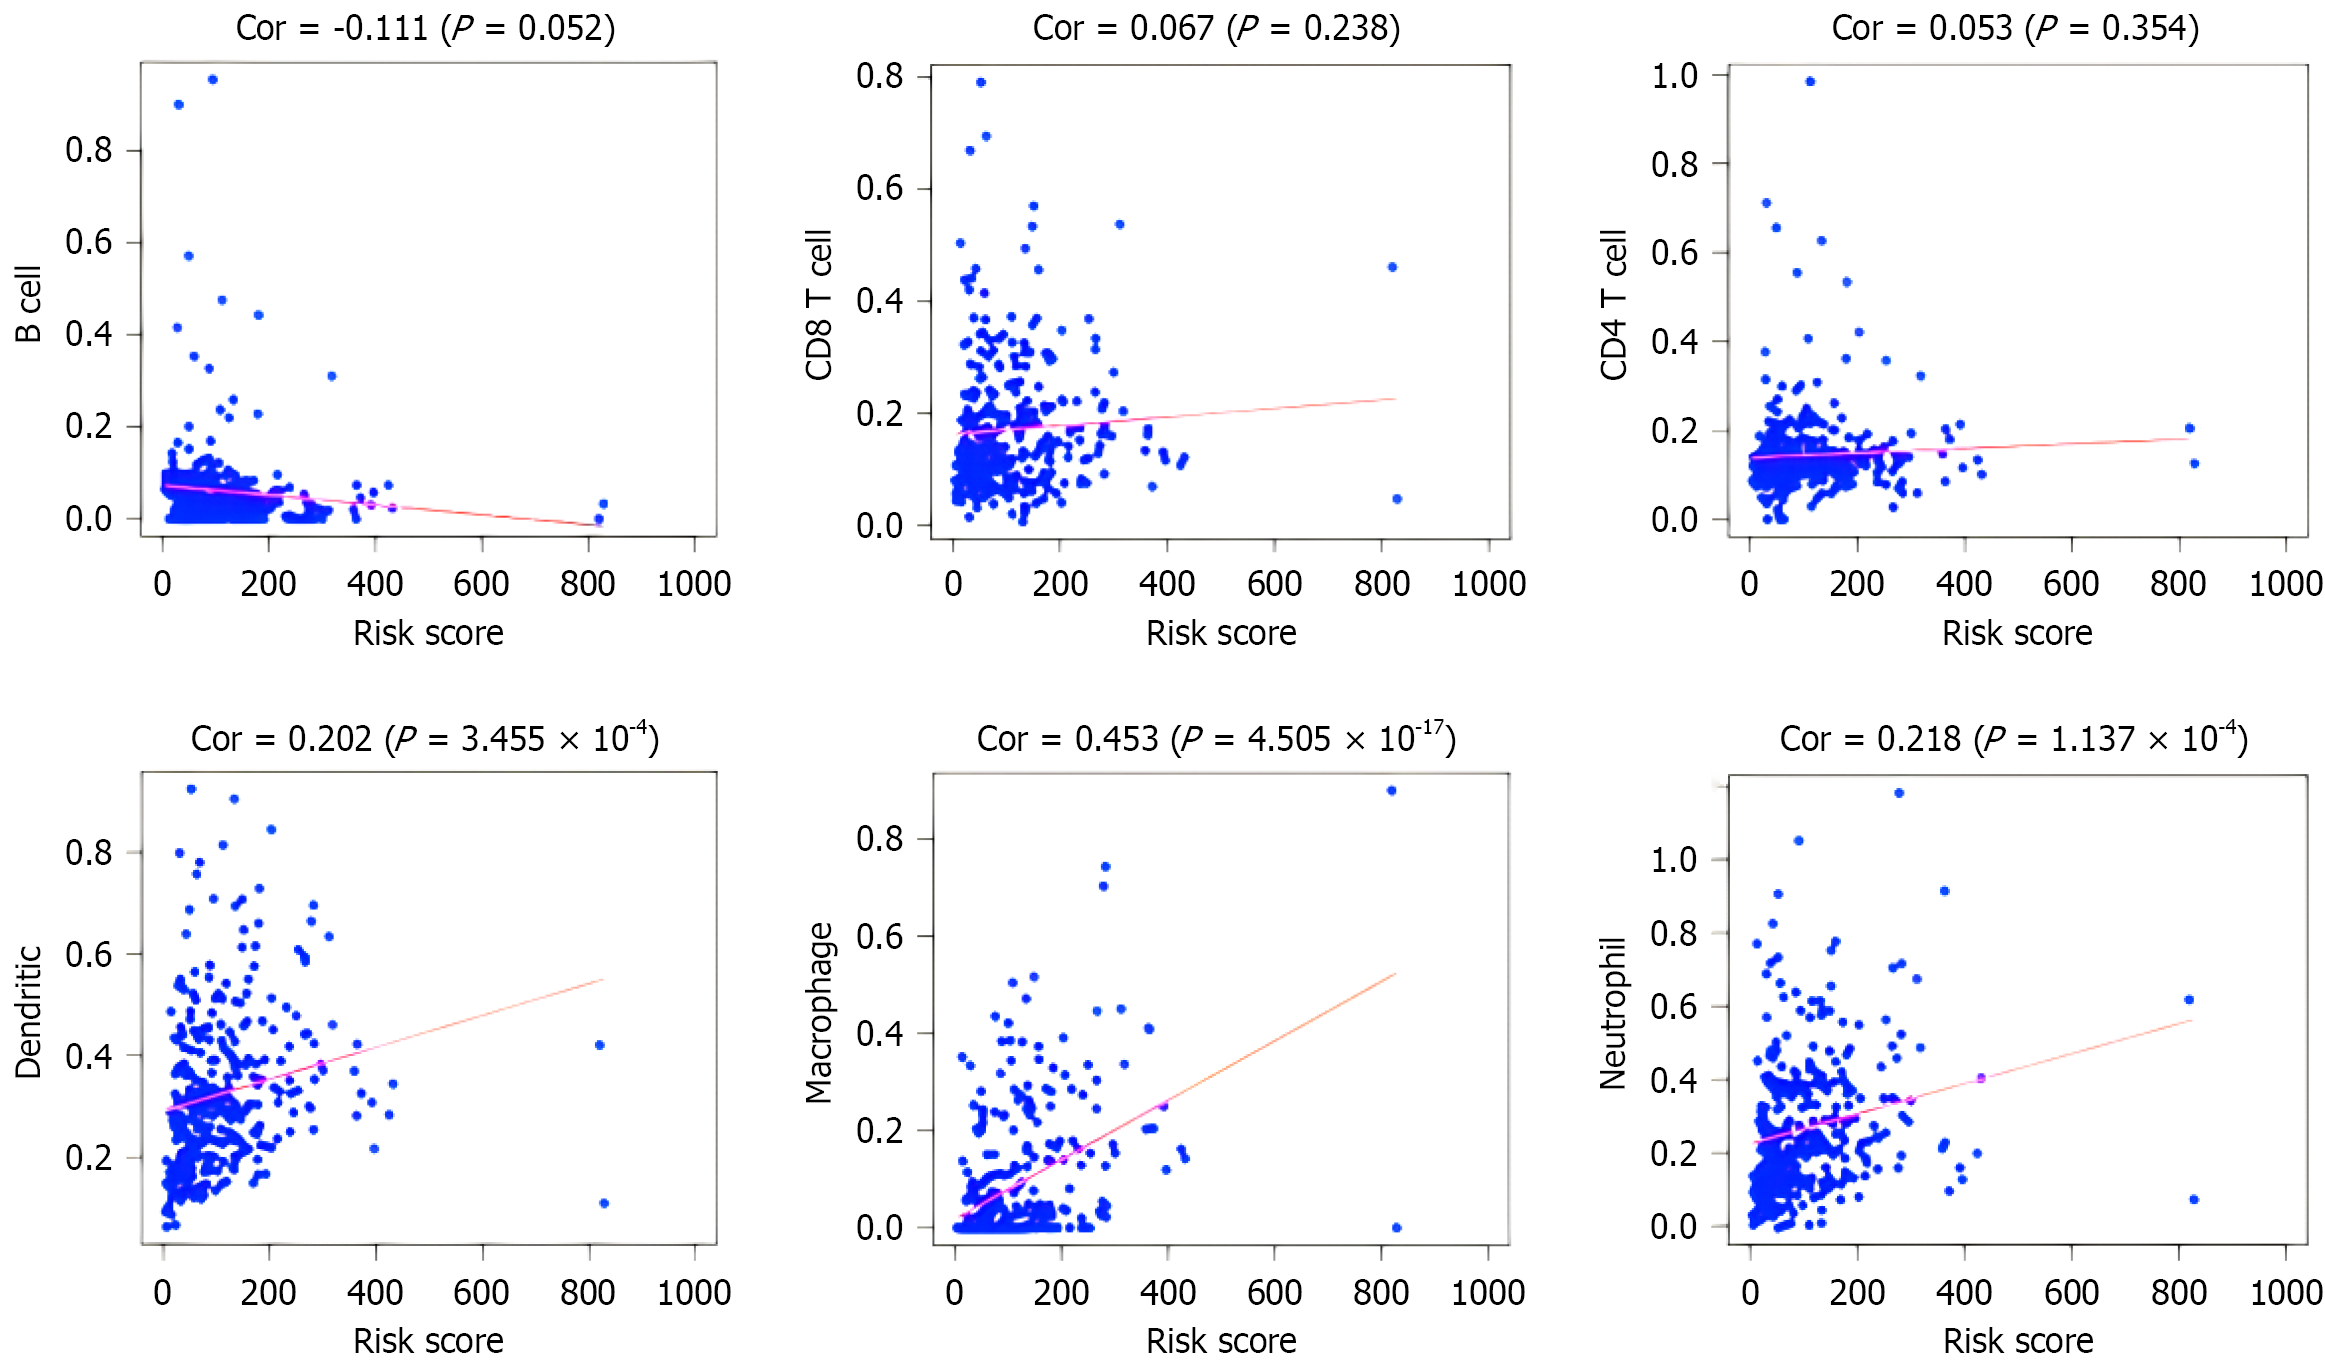
Figure 1 High-risk and low-risk groups and immune infiltration of various immune cells.
Correlation analysis between risk score and immune cell infiltration levels. Scatter plots displaying the correlations between risk score (X-axis) and the abundance of six immune cell types (Y-axis). CD8+ T cells (correlation coefficient = 0.411, P = 3.052 × 10⁻¹⁸); CD4+ T cells (correlation coefficient = 0.587, P = 6.238 × 10-40), cancer-associated fibroblasts (correlation coefficient = 0.683, P = 3.354 × 10-58), dendritic cells (correlation coefficient = 0.302, P = 3.455 × 10⁻¹⁰), tumor-associated macrophages (correlation coefficient = 0.453, P = 5.05 × 10⁻²²), and neutrophils (correlation coefficient = 0.218, P = × 10-5). All immune cell types showed significant positive correlations with risk score, with cancer-associated fibroblasts demonstrating the strongest correlation. Each dot represents an individual sample, and the gray shaded area indicates the 95% confidence interval of the regression line. Cor: Correlation coefficient.
- Citation: Yang HJ, Liu B. Spatial immune cell architecture after gastric cancer surgery predicts prognosis. World J Gastrointest Surg 2026; 18(2): 113530
- URL: https://www.wjgnet.com/1948-9366/full/v18/i2/113530.htm
- DOI: https://dx.doi.org/10.4240/wjgs.v18.i2.113530