
















©Author(s) (or their employer(s)) 2026.
World J Gastrointest Surg. Feb 27, 2026; 18(2): 113021
Published online Feb 27, 2026. doi: 10.4240/wjgs.v18.i2.113021
Published online Feb 27, 2026. doi: 10.4240/wjgs.v18.i2.113021
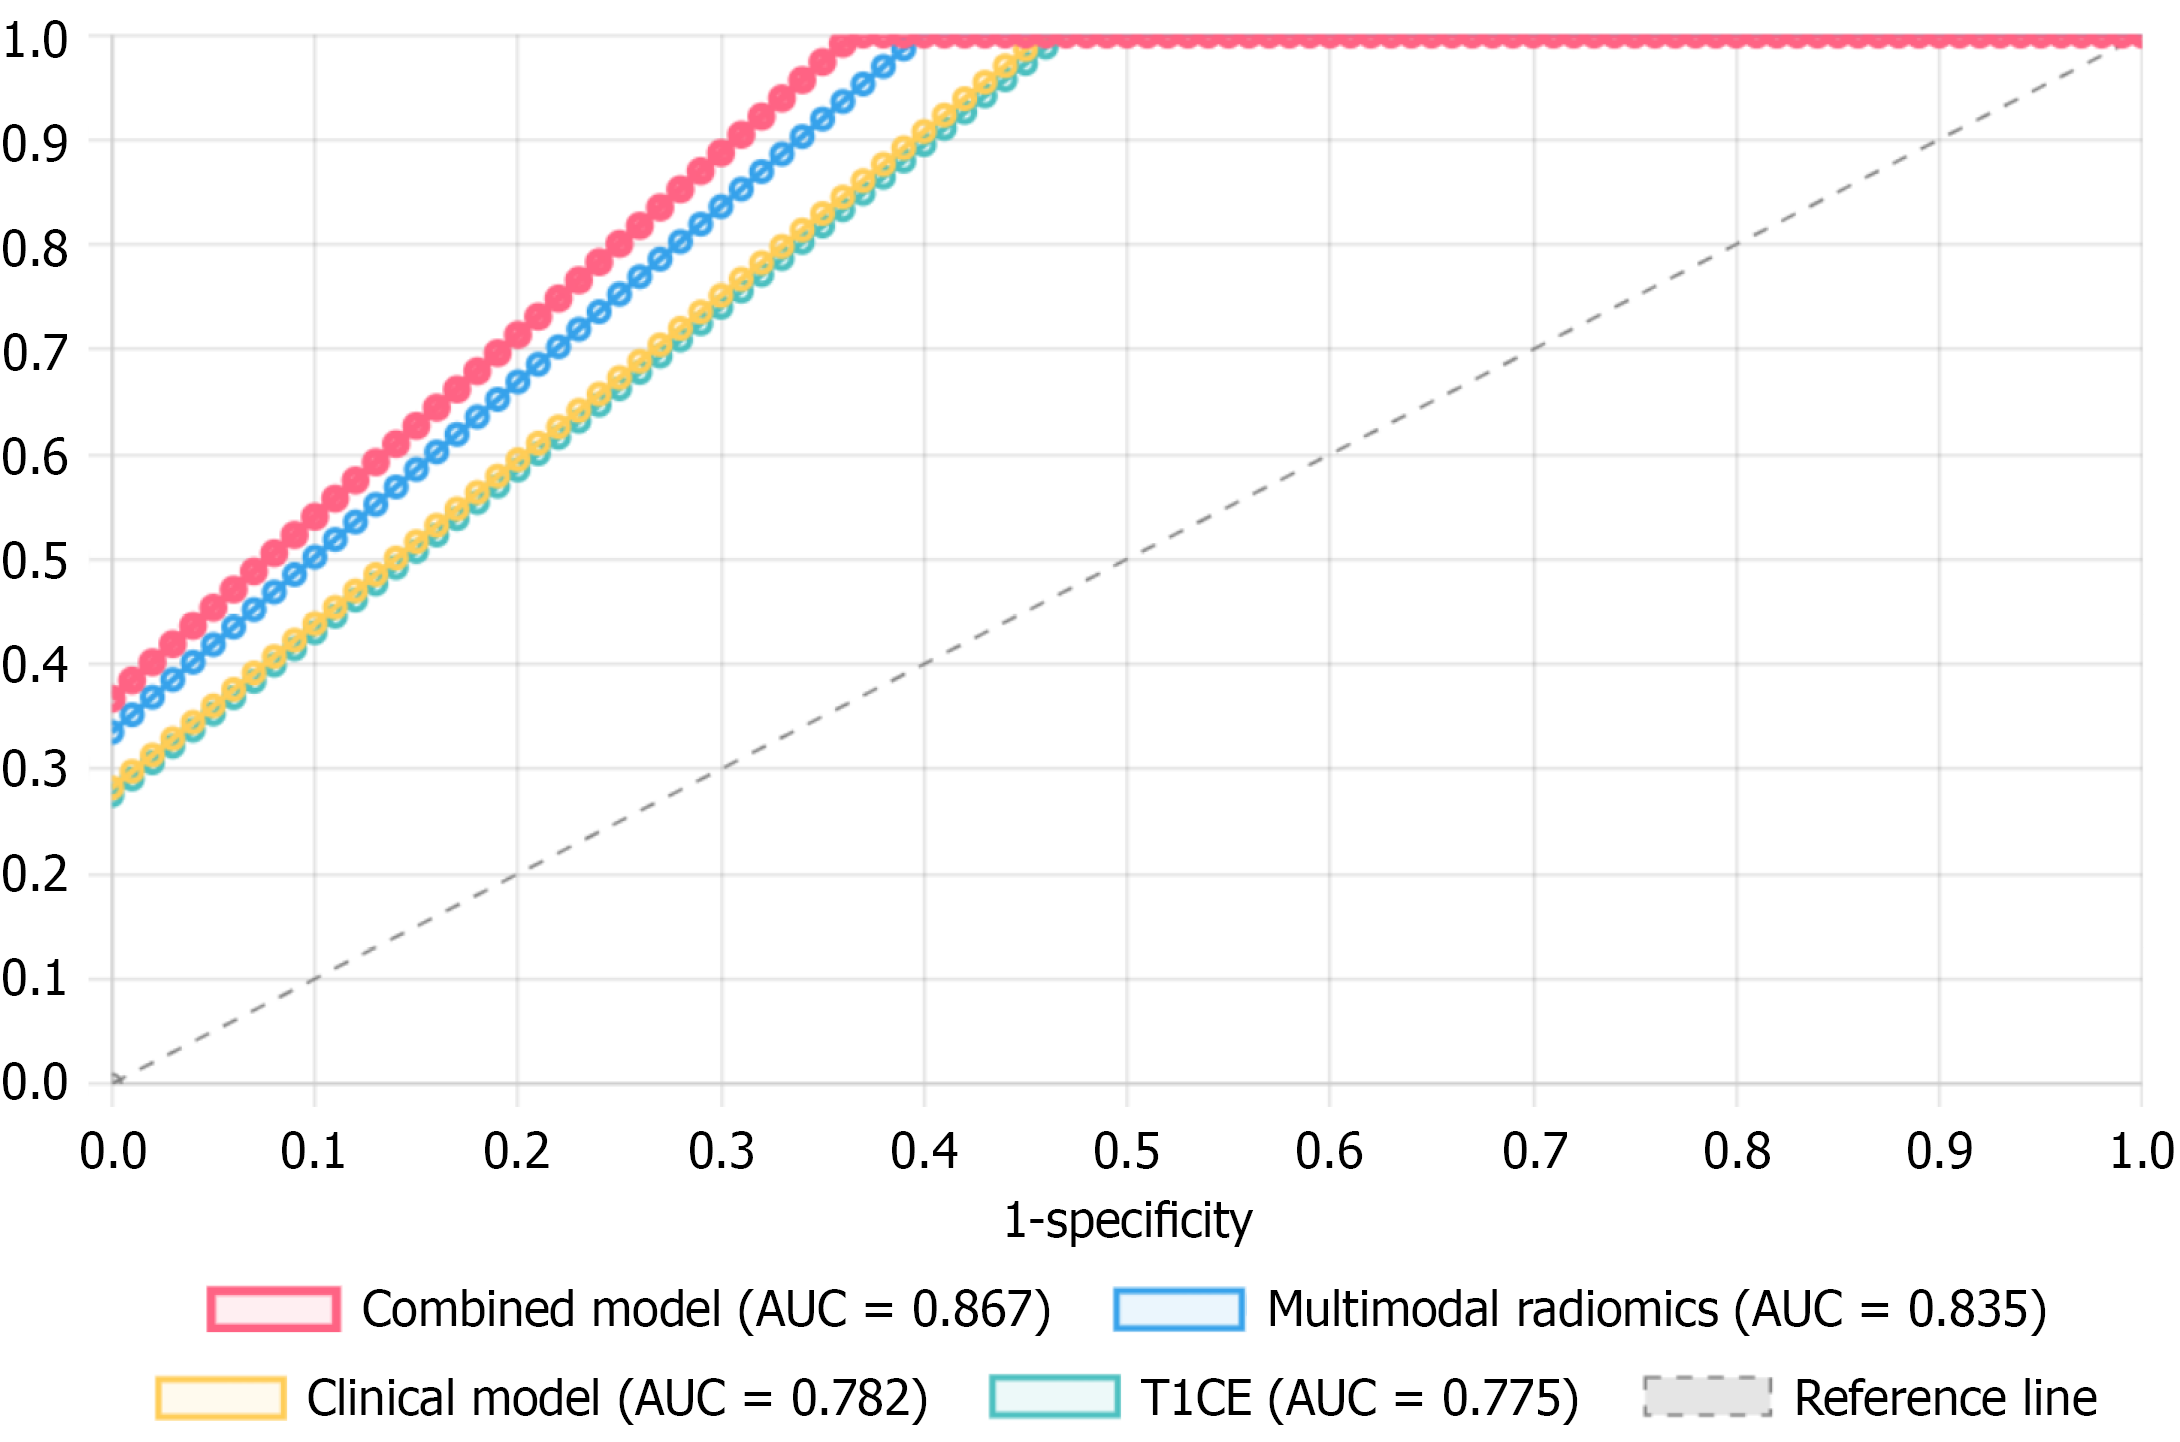
Figure 5 Receiver operating characteristic curve comparison of different models (test set).
Receiver operating characteristic curves comparing the diagnostic performance of the combined model [area under the curve (AUC) = 0.867], multimodal radiomics (AUC = 0.835), clinical model (AUC = 0.782) and T1-weighted contrast-enhanced imaging alone (AUC = 0.775) for predicting neural invasion. The dashed diagonal indicates the reference line (AUC = 0.5). AUC: Area under the curve; T1CE: T1-weighted contrast-enhanced imaging.
- Citation: Zhu ZH, Liang Y, Shi M. Prediction of lymphovascular invasion in rectal cancer based on multimodal magnetic resonance imaging radiomics model. World J Gastrointest Surg 2026; 18(2): 113021
- URL: https://www.wjgnet.com/1948-9366/full/v18/i2/113021.htm
- DOI: https://dx.doi.org/10.4240/wjgs.v18.i2.113021