
















©Author(s) (or their employer(s)) 2026.
World J Gastrointest Surg. Feb 27, 2026; 18(2): 113021
Published online Feb 27, 2026. doi: 10.4240/wjgs.v18.i2.113021
Published online Feb 27, 2026. doi: 10.4240/wjgs.v18.i2.113021
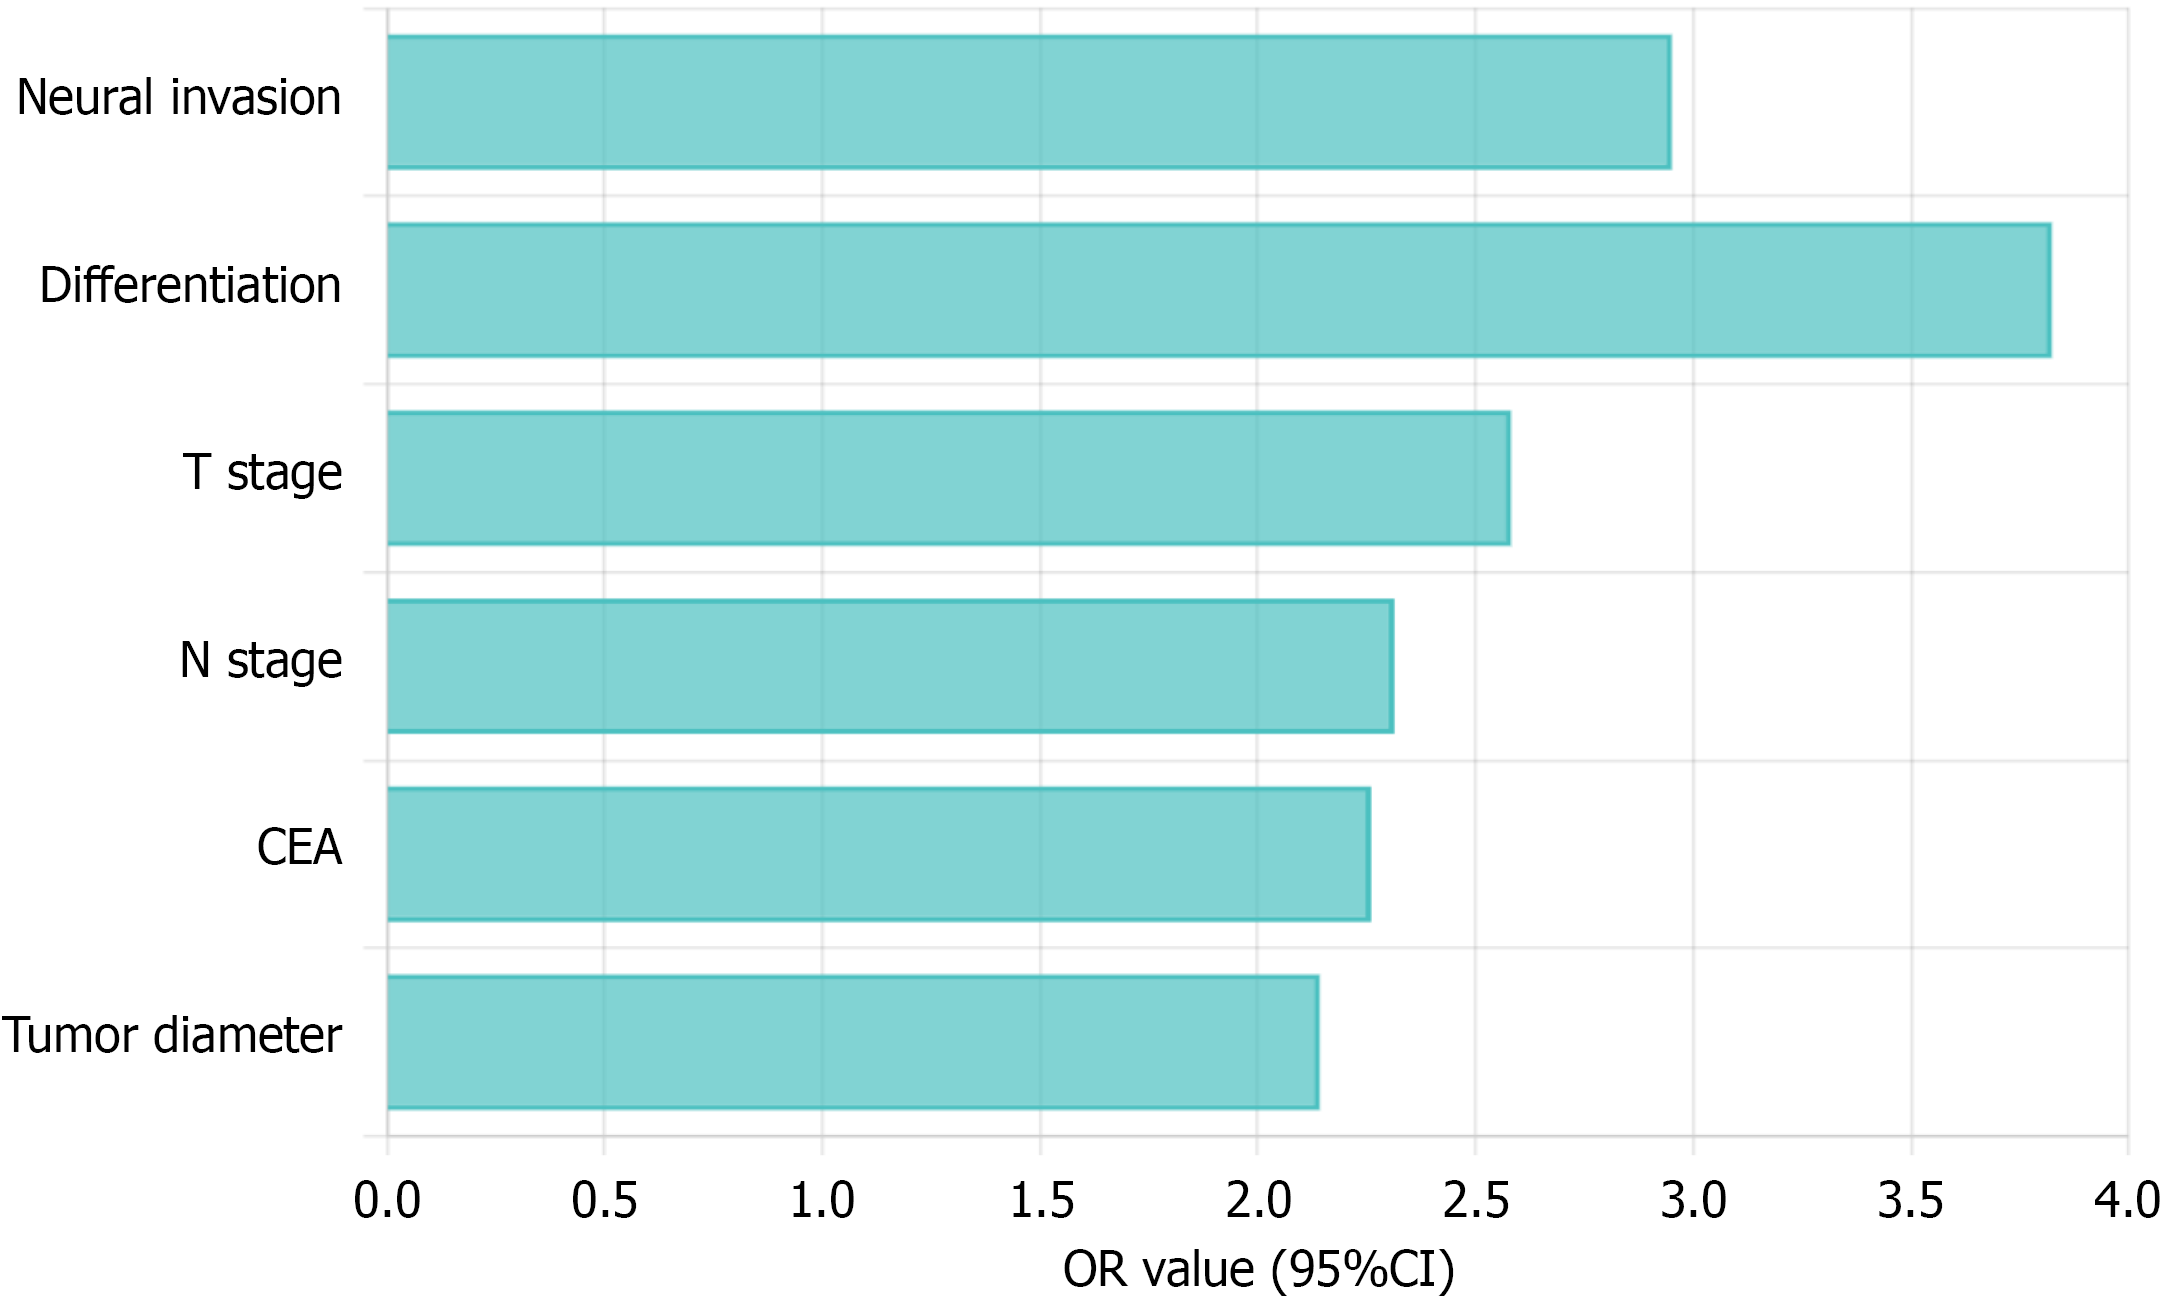
Figure 4 Forest plot of independent predictors for lymphovascular invasion.
Forest plot of clinicopathologic predictors of neural invasion. Horizontal lines represent odds ratio with 95% confidence intervals; vertical reference line at odds ratio = 1. OR: Odds ratio; CI: Confidence interval; CEA: Carcinoembryonic antigen.
- Citation: Zhu ZH, Liang Y, Shi M. Prediction of lymphovascular invasion in rectal cancer based on multimodal magnetic resonance imaging radiomics model. World J Gastrointest Surg 2026; 18(2): 113021
- URL: https://www.wjgnet.com/1948-9366/full/v18/i2/113021.htm
- DOI: https://dx.doi.org/10.4240/wjgs.v18.i2.113021