















Copyright: ©Author(s) 2026.
World J Gastrointest Surg. Nov 27, 2026; 18(11): 125793
Published online Nov 27, 2026. doi: 10.4240/wjgs.125793
Published online Nov 27, 2026. doi: 10.4240/wjgs.125793
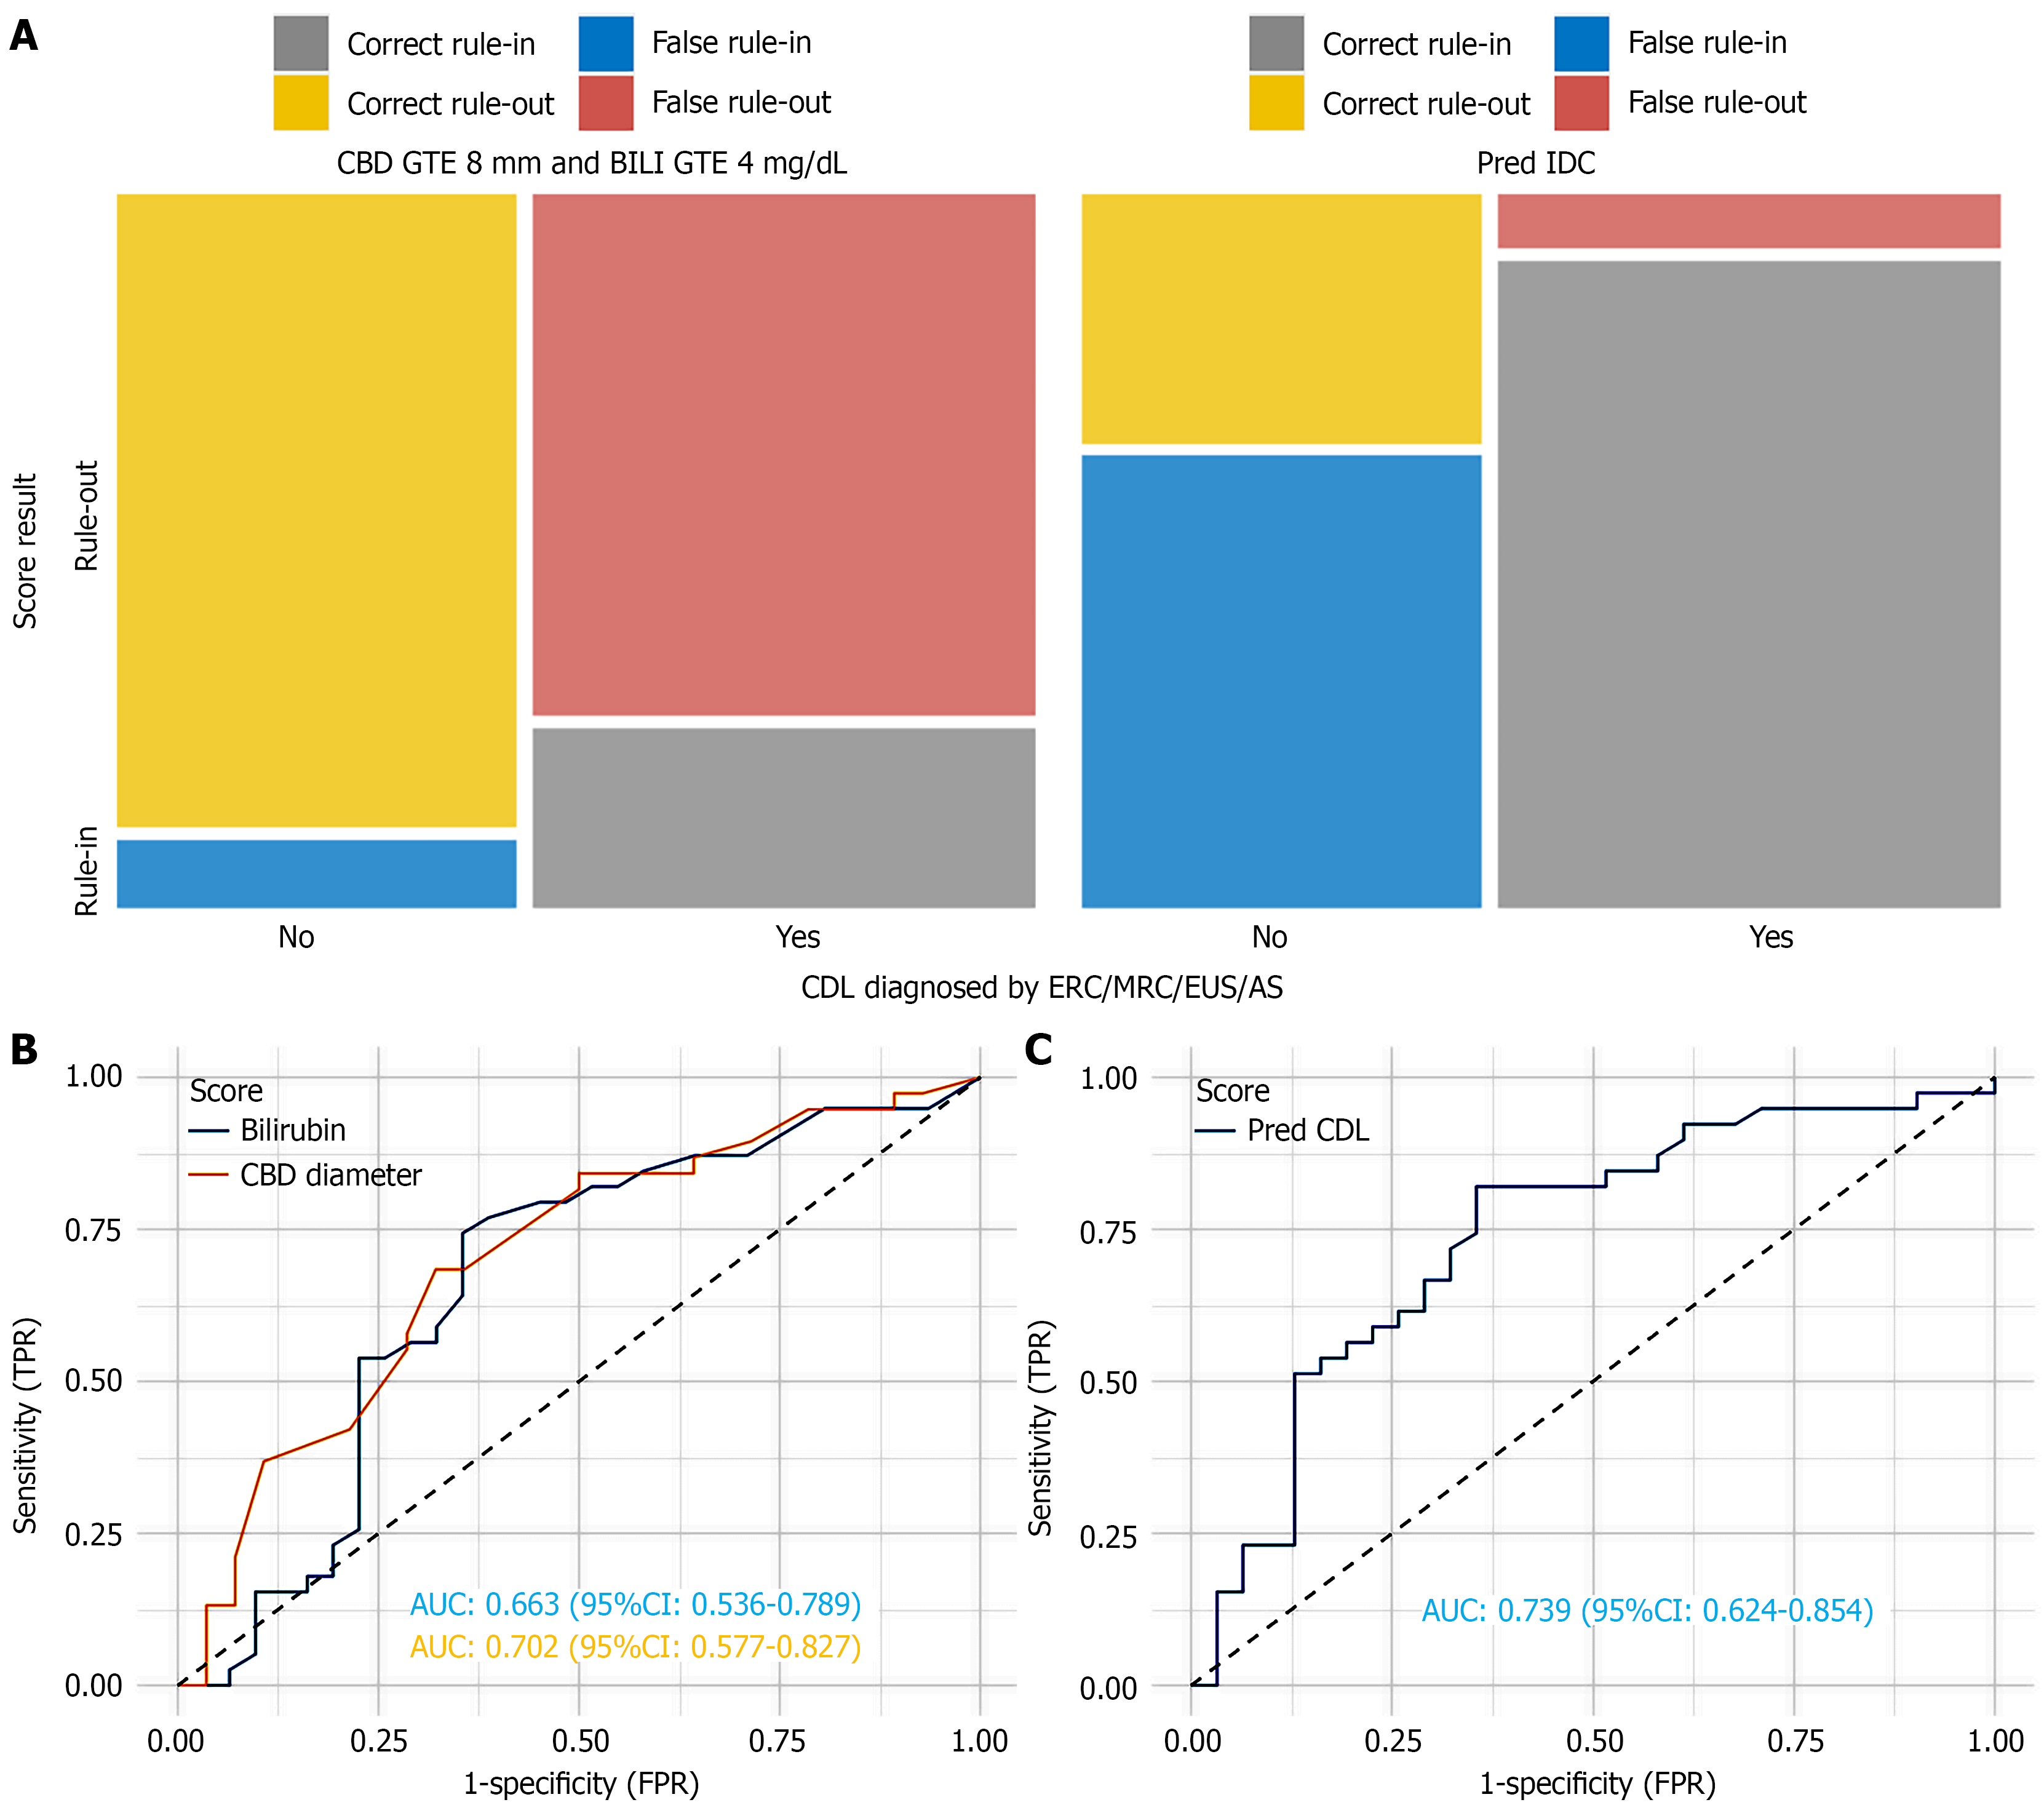
Figure 3 Comparison of decision rules.
A: Mosaic diagram in which each field’s size corresponds to the number of correct and false rule-in and rule-out classifications (i.e., the four cells of the respective contingency tables). False rule-outs in red signify missed CDL, and correct rule-outs in yellow correspond to true negatives for CDL; B: Two receiver operating characteristic (ROC) curves were plotted for the random forest model and the common bile duct diameter; C: ROC curve for our predictive model. CDL: Choledocholithiasis; AUC: Area under the curve; CI: Confidence interval; FPR: False positive rate; CBD: Common bile duct; GTE: Greater than or equal to.
- Citation: Sirtl S, Schäfer APG, Bretthauer K, Hohmann E, Junge M, Ahmad M, Vielhauer J, Hausdorf A, Hubert MO, Velamazán R, Aghamaliyev U, Schirra J, Schulz C, Żorniak M, Beyer G, Mahajan UM, Mayerle J, Stubbe HC. Imaging-independent model for predicting choledocholithiasis in acute biliary pancreatitis. World J Gastrointest Surg 2026; 18(11): 125793
- URL: https://www.wjgnet.com/1948-9366/full/v18/i11/125793.htm
- DOI: https://dx.doi.org/10.4240/wjgs.125793