
















Copyright: ©Author(s) 2026.
World J Gastrointest Surg. Nov 27, 2026; 18(11): 124443
Published online Nov 27, 2026. doi: 10.4240/wjgs.124443
Published online Nov 27, 2026. doi: 10.4240/wjgs.124443
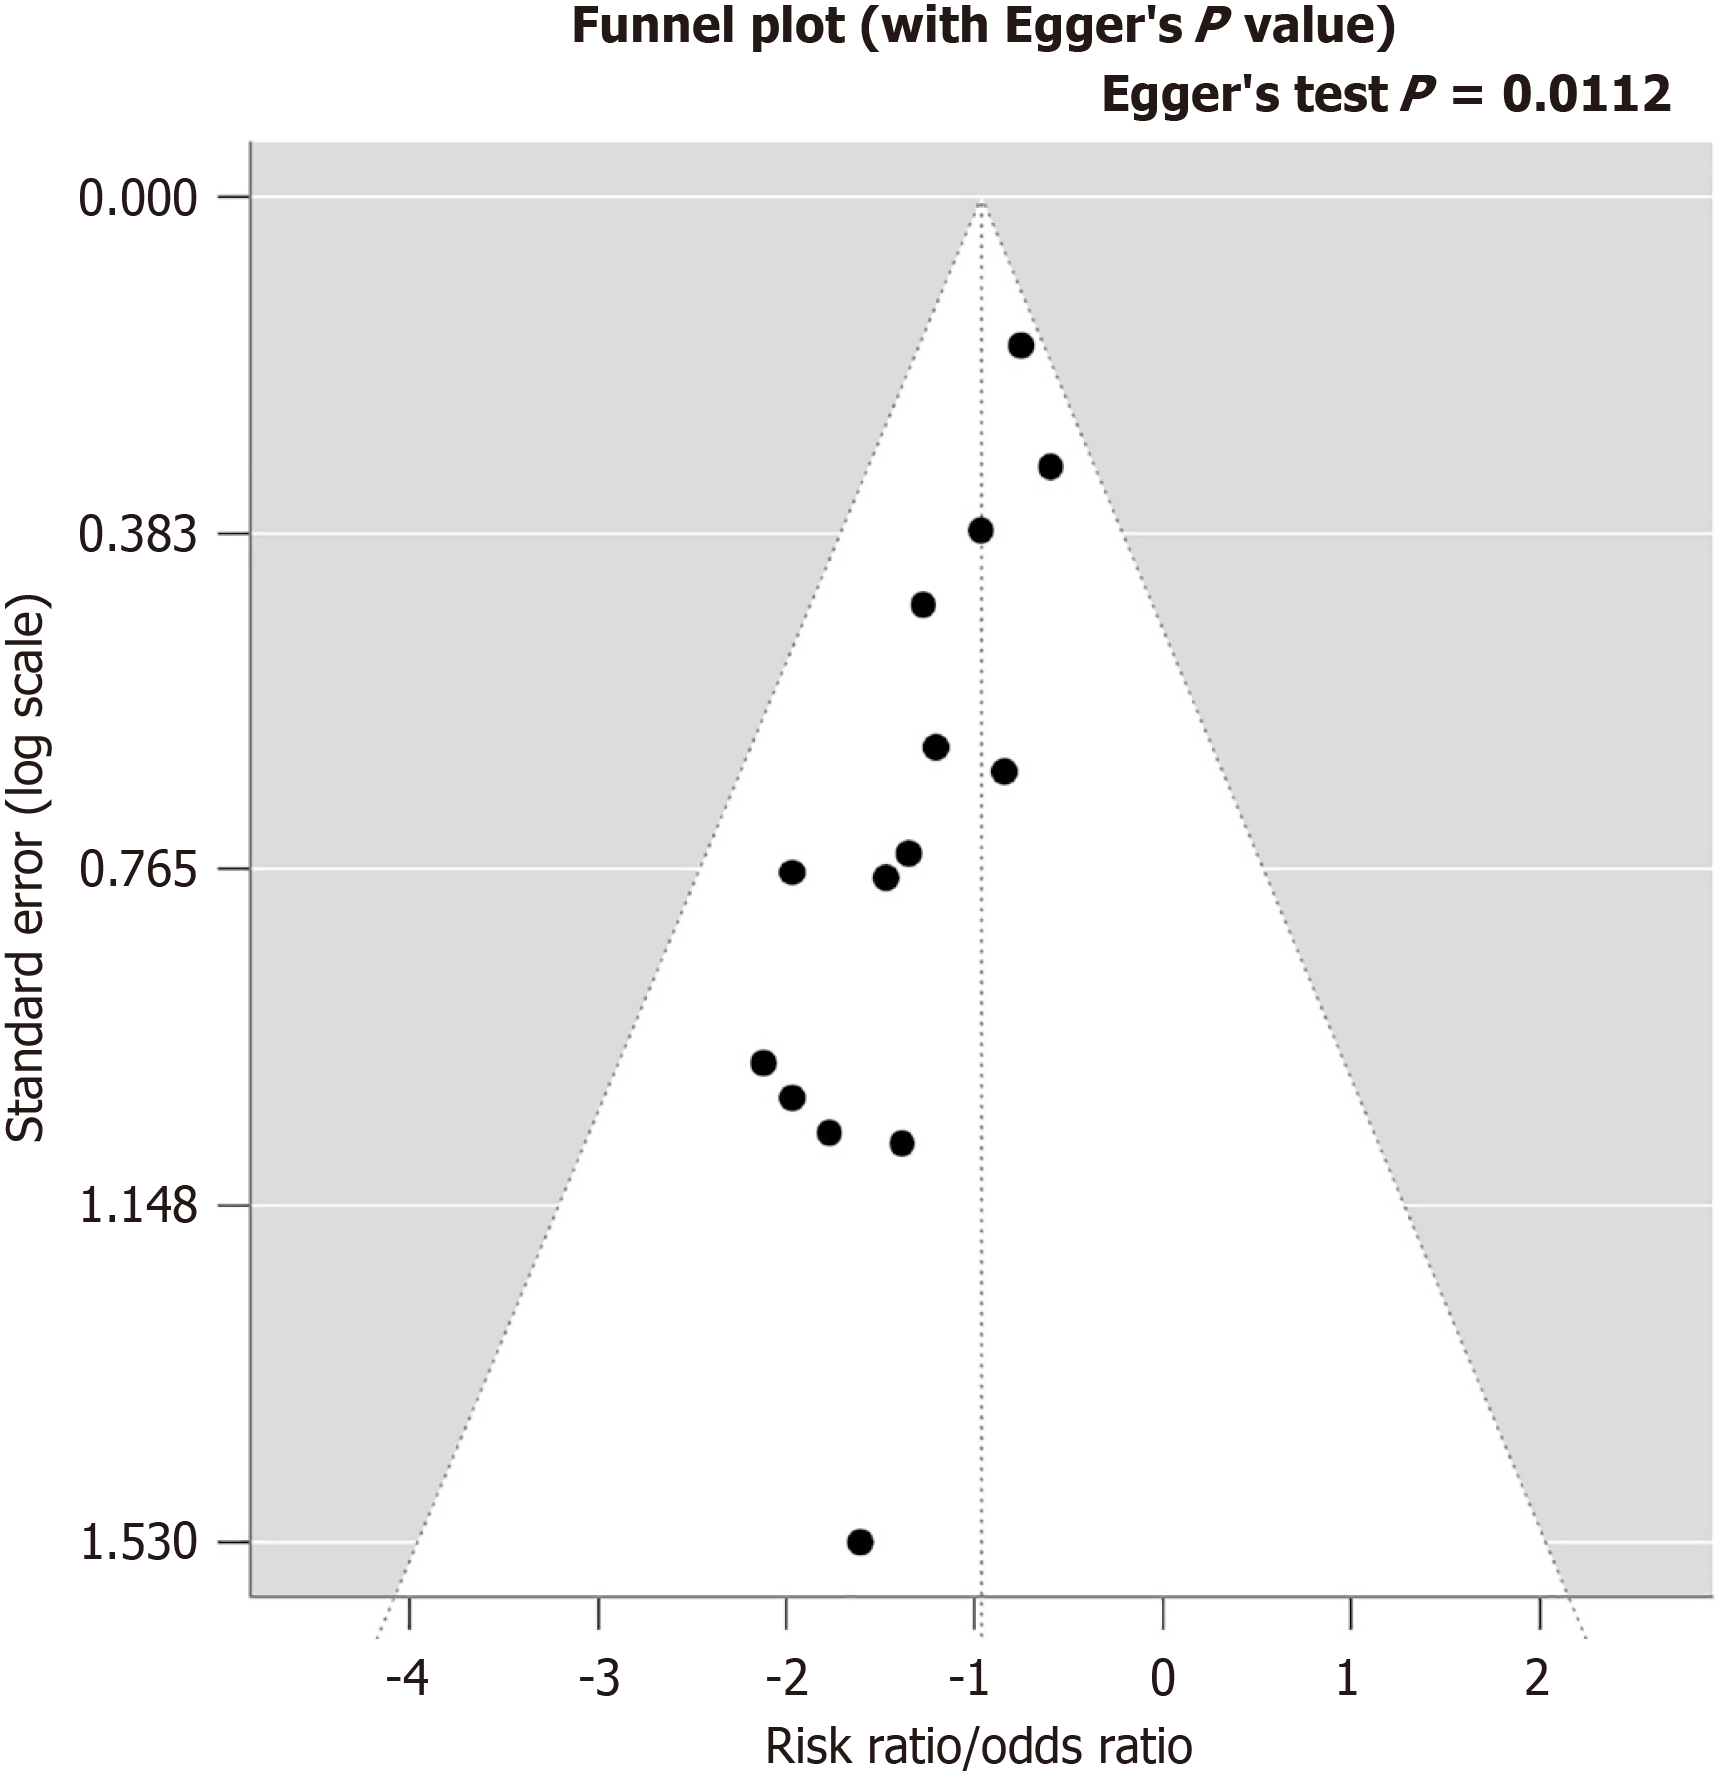
Figure 4 Funnel plot of the 14 included studies for assessing publication bias.
The horizontal axis represents the log risk ratio, and the vertical axis represents the standard error of the log risk ratio. The dashed vertical line indicates the pooled effect estimate. The diagonal lines represent the pseudo-95% confidence limits around the pooled estimate, indicating the expected distribution of studies in the absence of publication bias. Visual inspection suggests some asymmetry, with smaller studies clustering predominantly on one side of the pooled estimate. Egger’s regression test yielded a statistically significant result (z = -2.54, P = 0.011), which may indicate potential publication bias or other sources of small-study effects. However, with only 14 studies included, the test has limited power, and this result should be interpreted with caution.
- Citation: Wang XY, Liu YY, Zhang YF, Zhou XQ, Sun MC, Zheng Q. Preventive strategies for post-endoscopic retrograde cholangiopancreatography pancreatitis: A systematic review and meta-analysis. World J Gastrointest Surg 2026; 18(11): 124443
- URL: https://www.wjgnet.com/1948-9366/full/v18/i11/124443.htm
- DOI: https://dx.doi.org/10.4240/wjgs.124443