
















©The Author(s) 2026.
World J Gastrointest Surg. Jan 27, 2026; 18(1): 114050
Published online Jan 27, 2026. doi: 10.4240/wjgs.v18.i1.114050
Published online Jan 27, 2026. doi: 10.4240/wjgs.v18.i1.114050
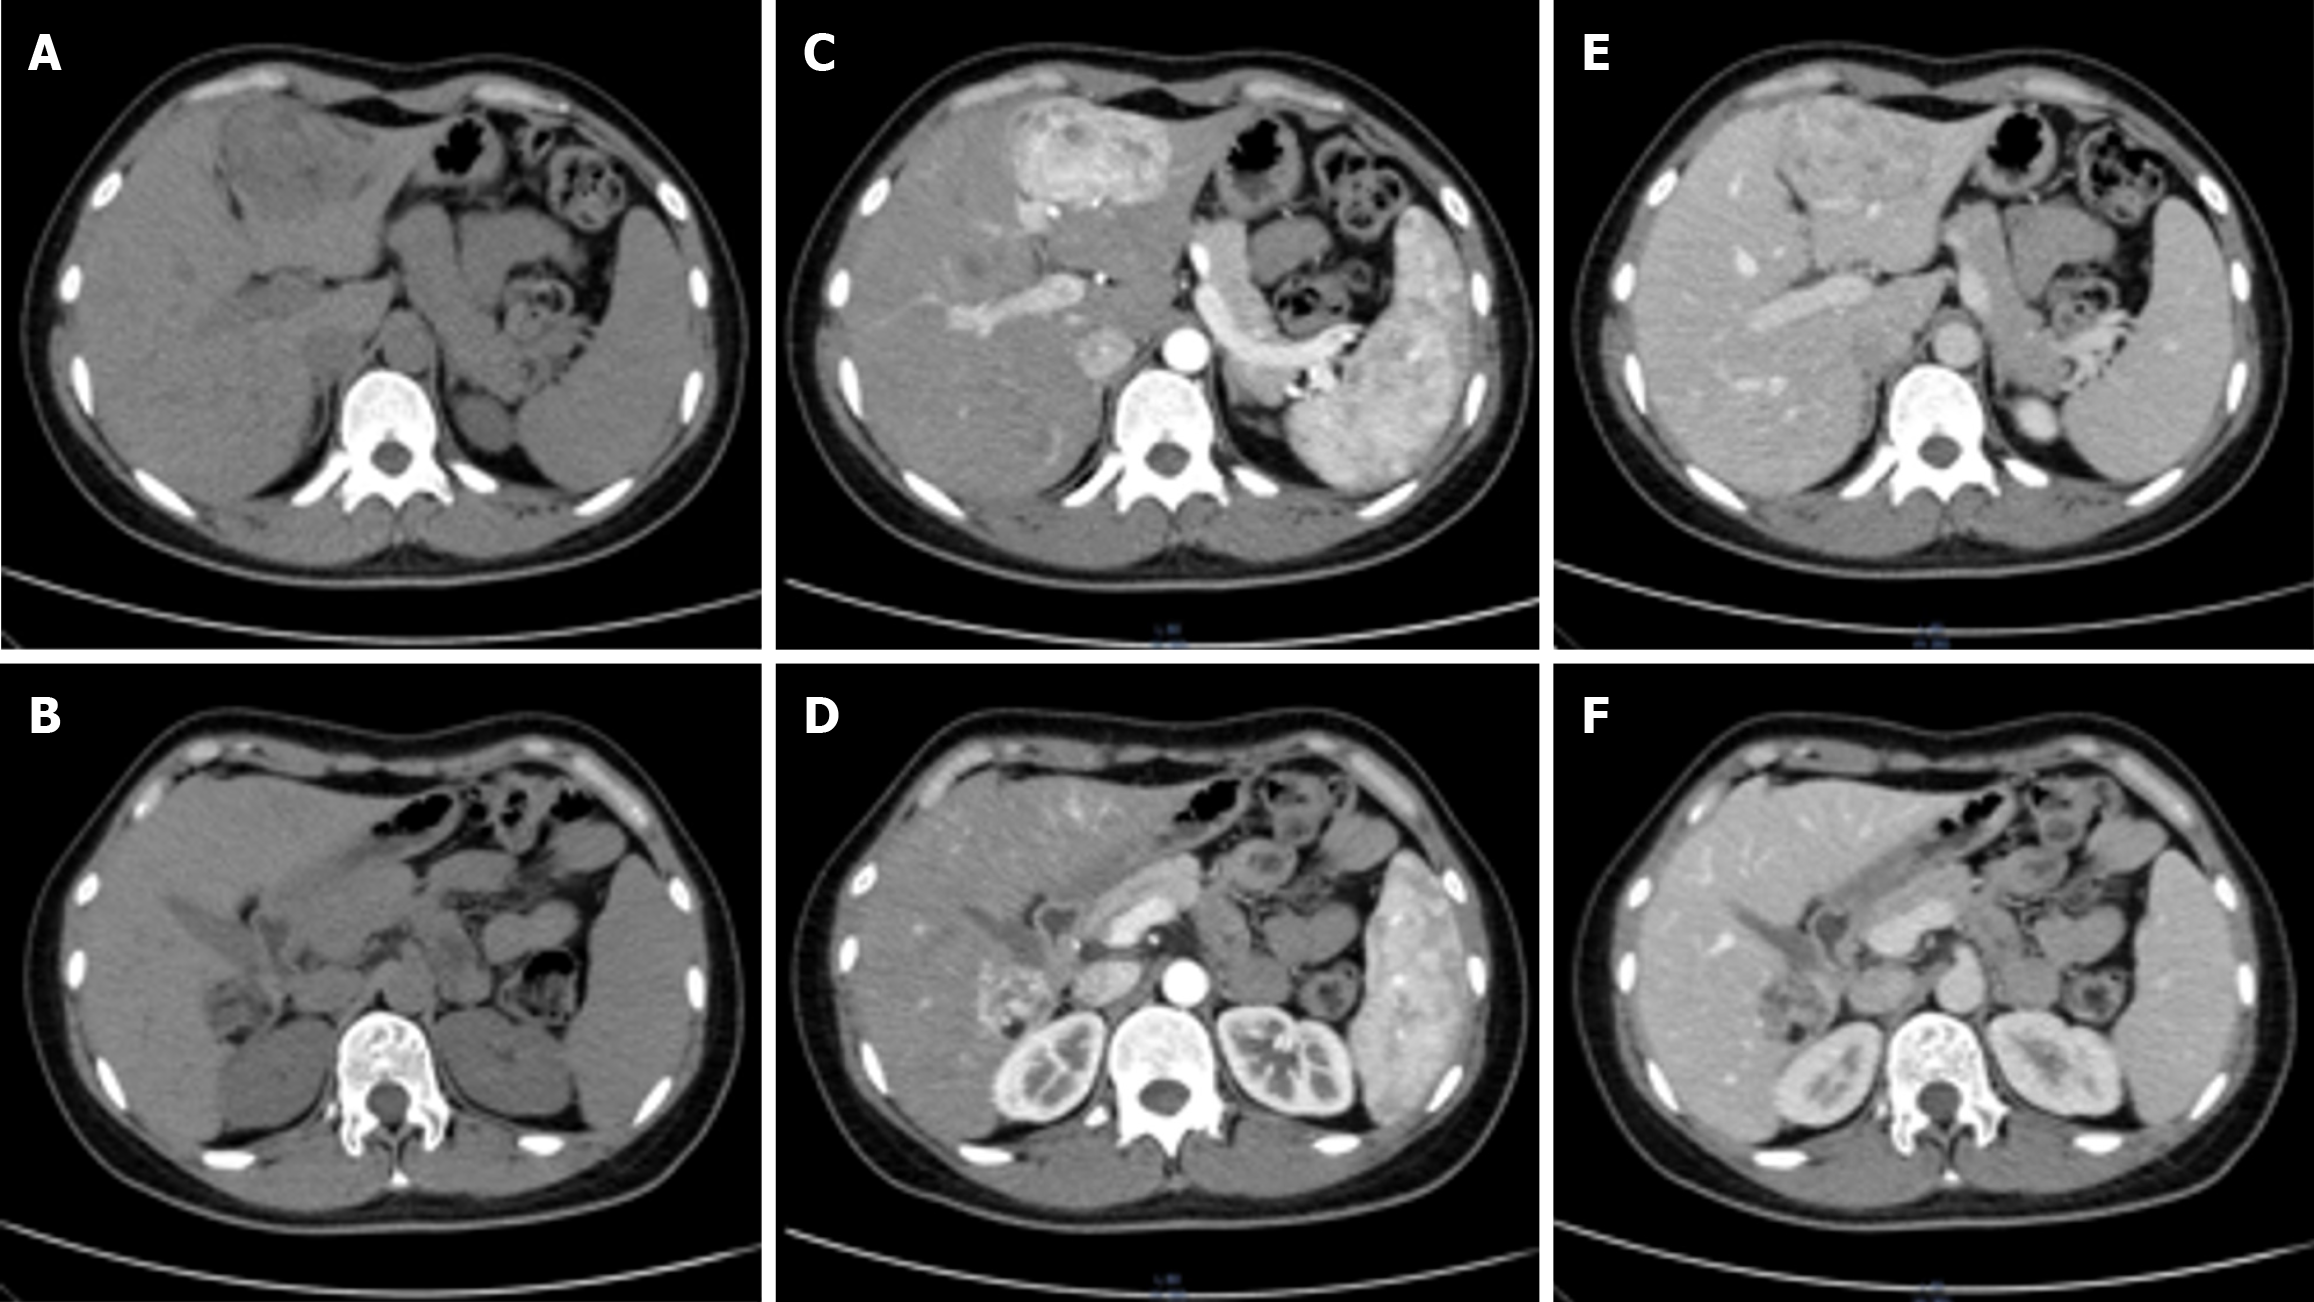
Figure 2 Computed tomography and contrast-enhanced computed tomography images.
A and B: Hypodense lesions located in segments S3 and S7 of the liver, measuring approximately 61 mm × 44 mm and 33 mm × 27 mm, respectively, with heterogeneous density; C and D: During the arterial phase, both lesions demonstrated marked and heterogeneous enhancement with visible intratumoral vasculature; E and F: In the portal venous phase, the lesions showed reduced enhancement and appeared isodense relative to the surrounding parenchyma.
- Citation: Wang F, Shi ZX, He XY, Han XJ, Wang JH, Yang JY, Cui LM. Hepatic epithelioid angiomyolipoma treated with laparoscopic resection and transcatheter arterial embolization first time: A case report and review of literature. World J Gastrointest Surg 2026; 18(1): 114050
- URL: https://www.wjgnet.com/1948-9366/full/v18/i1/114050.htm
- DOI: https://dx.doi.org/10.4240/wjgs.v18.i1.114050