
















©The Author(s) 2026.
World J Gastrointest Surg. Jan 27, 2026; 18(1): 113894
Published online Jan 27, 2026. doi: 10.4240/wjgs.v18.i1.113894
Published online Jan 27, 2026. doi: 10.4240/wjgs.v18.i1.113894
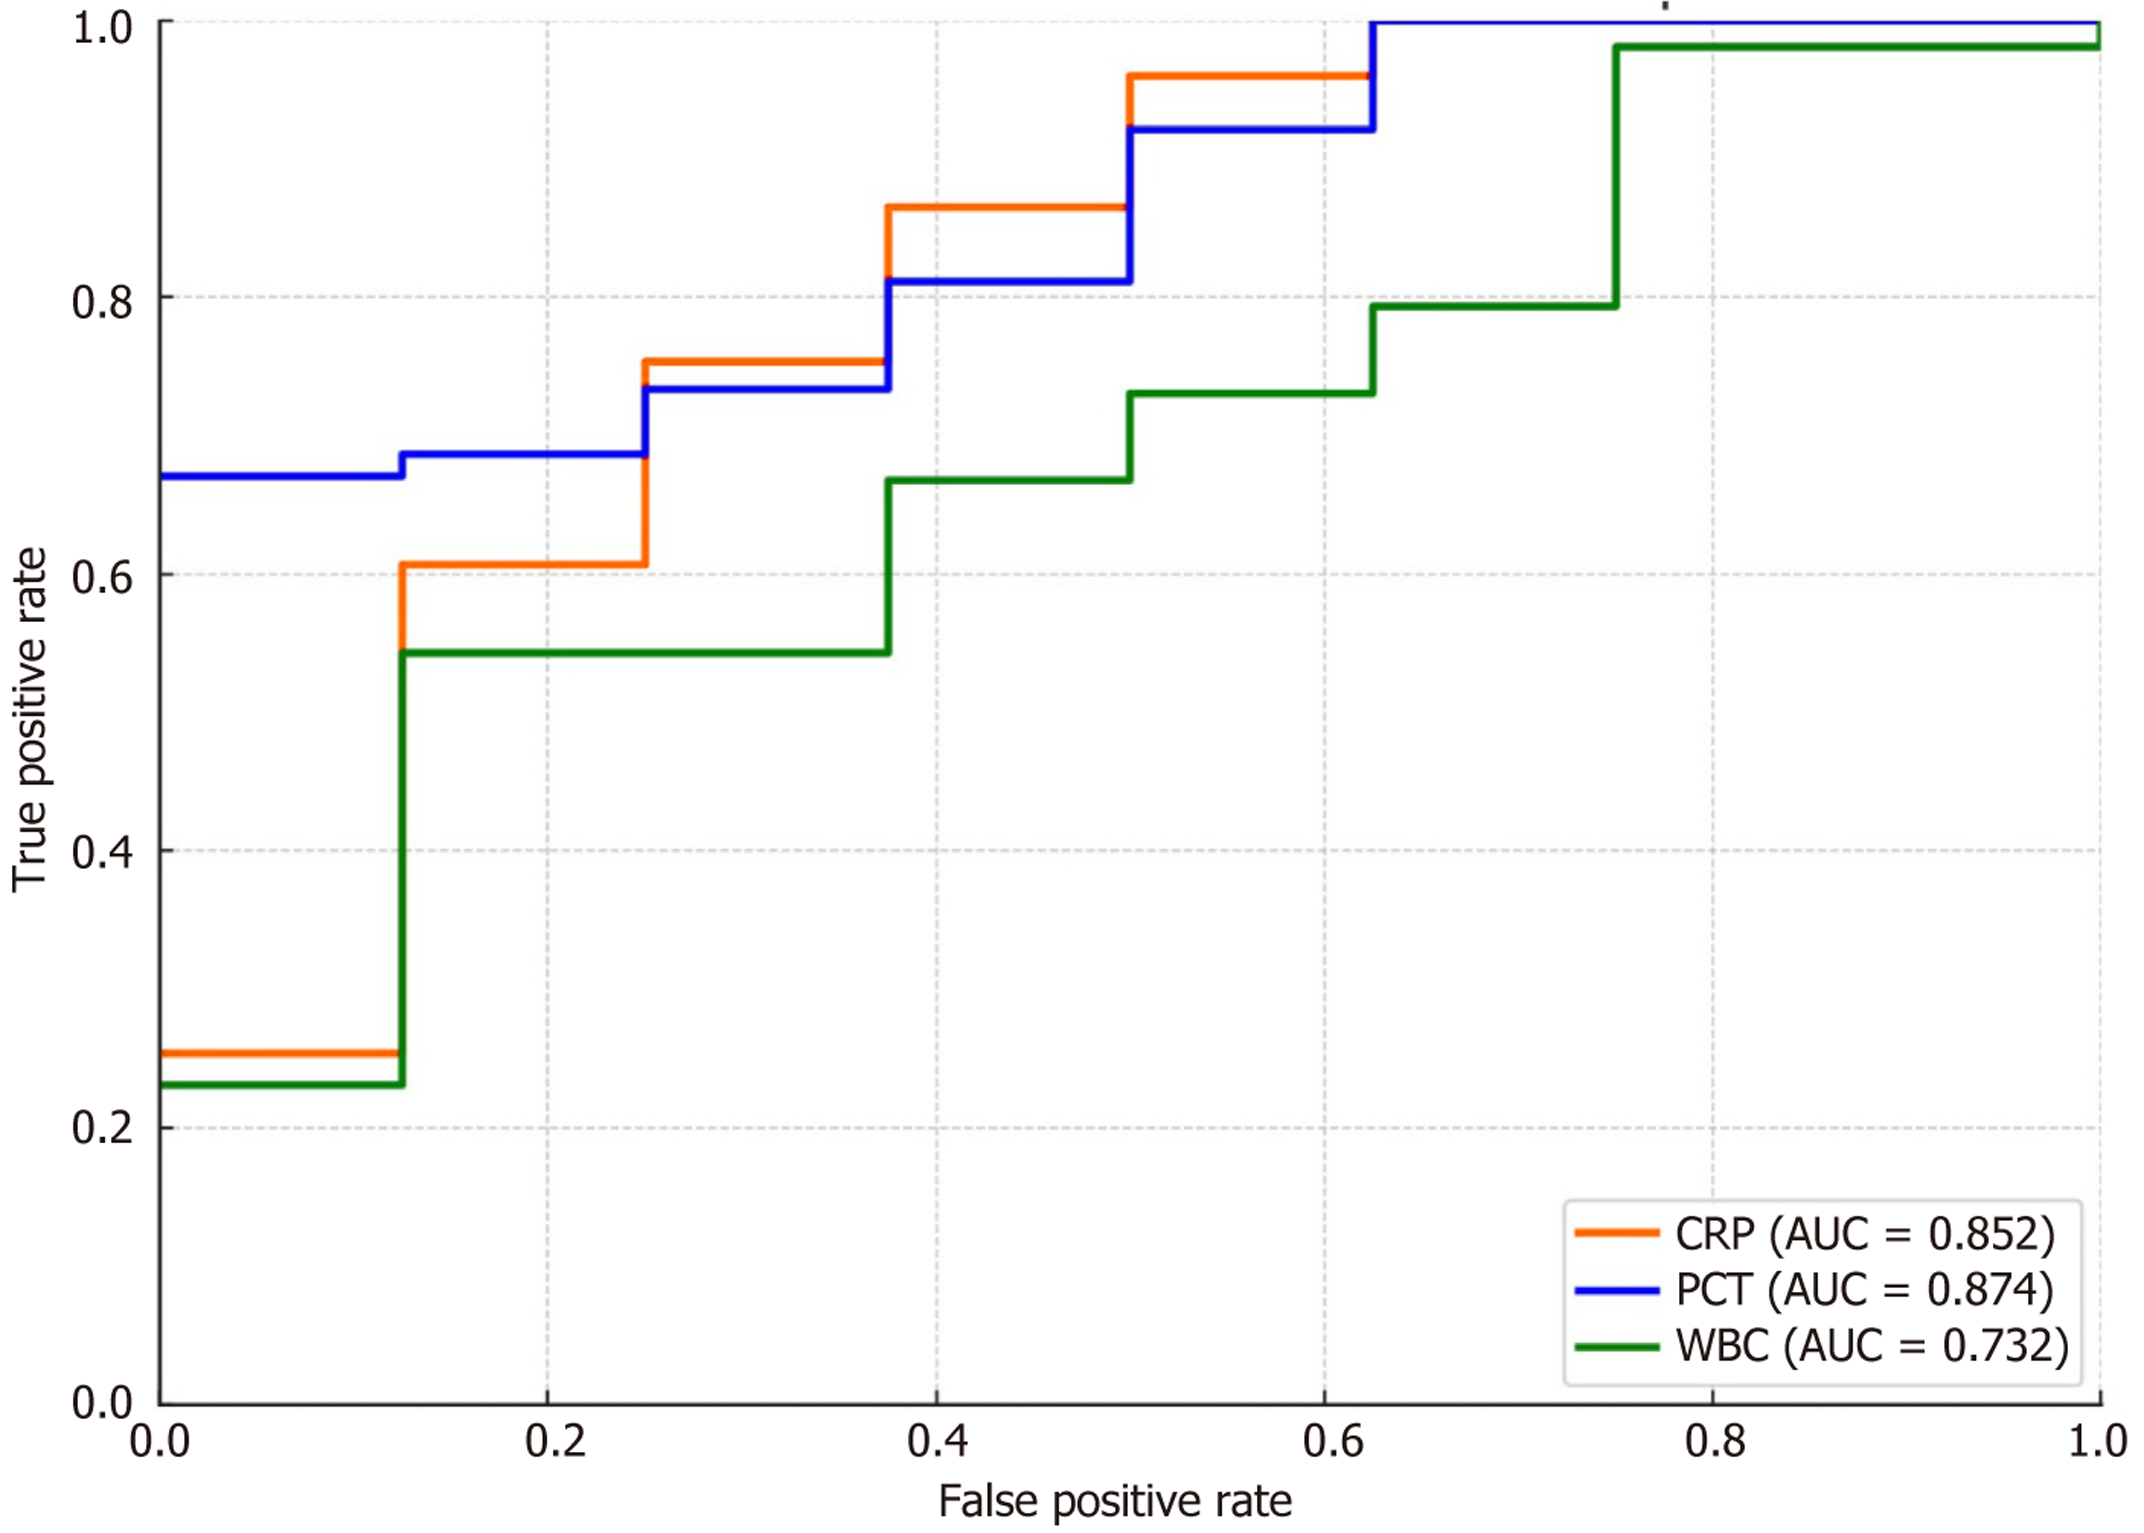
Figure 3 Receiver operating characteristic curve of diagnostic efficiency.
Receiver operating characteristic curves show the predictive performance of procalcitonin, C-reactive protein levels and white blood cell counts. The combined model (procalcitonin + mixed effusion) demonstrated superior predictive efficacy (area under the curve = 0.912) compared to the individual markers. CRP: C-reactive protein; PCT: Procalcitonin; WBC: White blood cell count; AUC: Area under the curve.
- Citation: Gao XX, Su SH, Huang DD. Dynamic ultrasound monitoring of intraperitoneal effusion for predicting complications after laparoscopic gastrectomy. World J Gastrointest Surg 2026; 18(1): 113894
- URL: https://www.wjgnet.com/1948-9366/full/v18/i1/113894.htm
- DOI: https://dx.doi.org/10.4240/wjgs.v18.i1.113894