
















©The Author(s) 2026.
World J Gastrointest Surg. Jan 27, 2026; 18(1): 111928
Published online Jan 27, 2026. doi: 10.4240/wjgs.v18.i1.111928
Published online Jan 27, 2026. doi: 10.4240/wjgs.v18.i1.111928
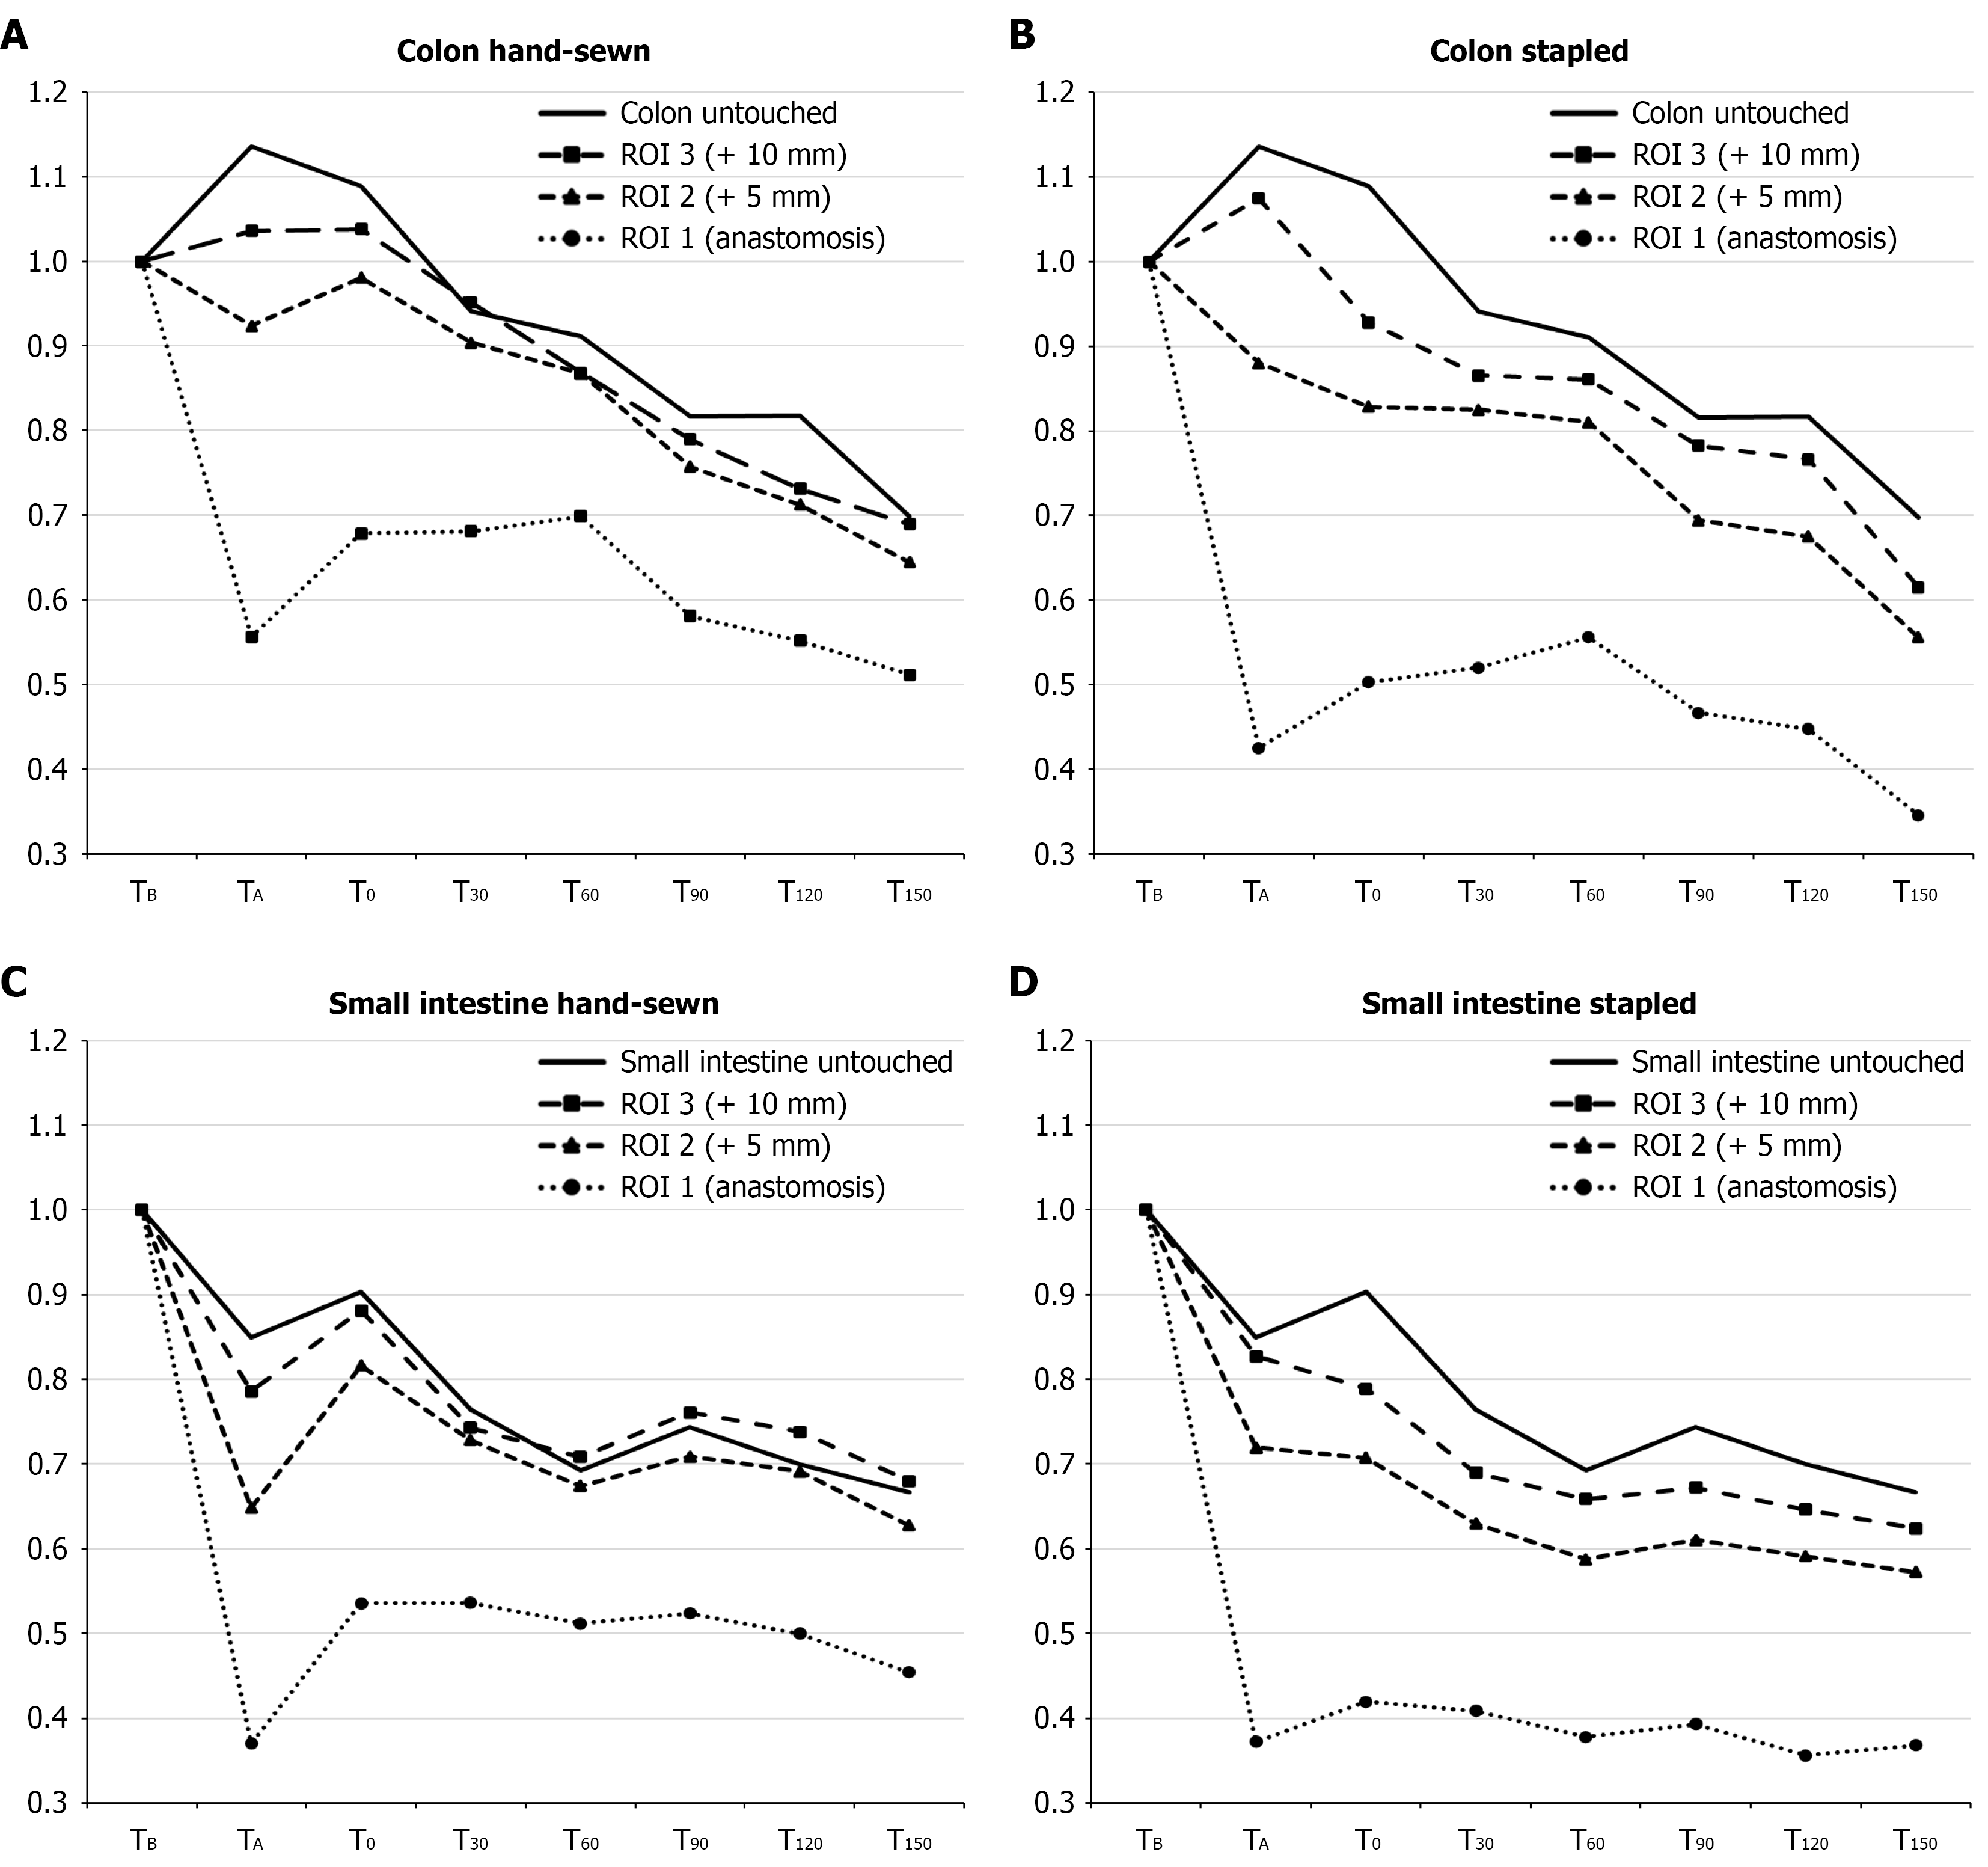
Figure 4 Graphical representation of the relative change in microcirculation over time compared to baseline.
A: Colon hand-sewn; B: Colon stapled; C: Small intestine hand-sewn; D: Small intestine stapled. The Y-axis represents the relative change compared to baseline values. X-axis represents time points: TB = Baseline measurements; TA = Immediately after anastomosis formation; T0 = After one hour of rest, start of Escherichia coli (E. coli) infusion; T30, T60, T90, T120, T150 = Measurements taken during E. coli infusion/sepsis, number indicates minutes from start of E. coli infusion. ROI: Region of interest.
- Citation: Paramasivam R, Jaensch C, Kristensen NM, Paramasivam SS, Woldeselassie H, Jensen LK, Madsen AH, Ørntoft MBW. Septic shock reduces intestinal microcirculation and anastomotic perfusion: A porcine laser speckle contrast imaging study. World J Gastrointest Surg 2026; 18(1): 111928
- URL: https://www.wjgnet.com/1948-9366/full/v18/i1/111928.htm
- DOI: https://dx.doi.org/10.4240/wjgs.v18.i1.111928