
















©The Author(s) 2026.
World J Gastrointest Surg. Jan 27, 2026; 18(1): 111928
Published online Jan 27, 2026. doi: 10.4240/wjgs.v18.i1.111928
Published online Jan 27, 2026. doi: 10.4240/wjgs.v18.i1.111928
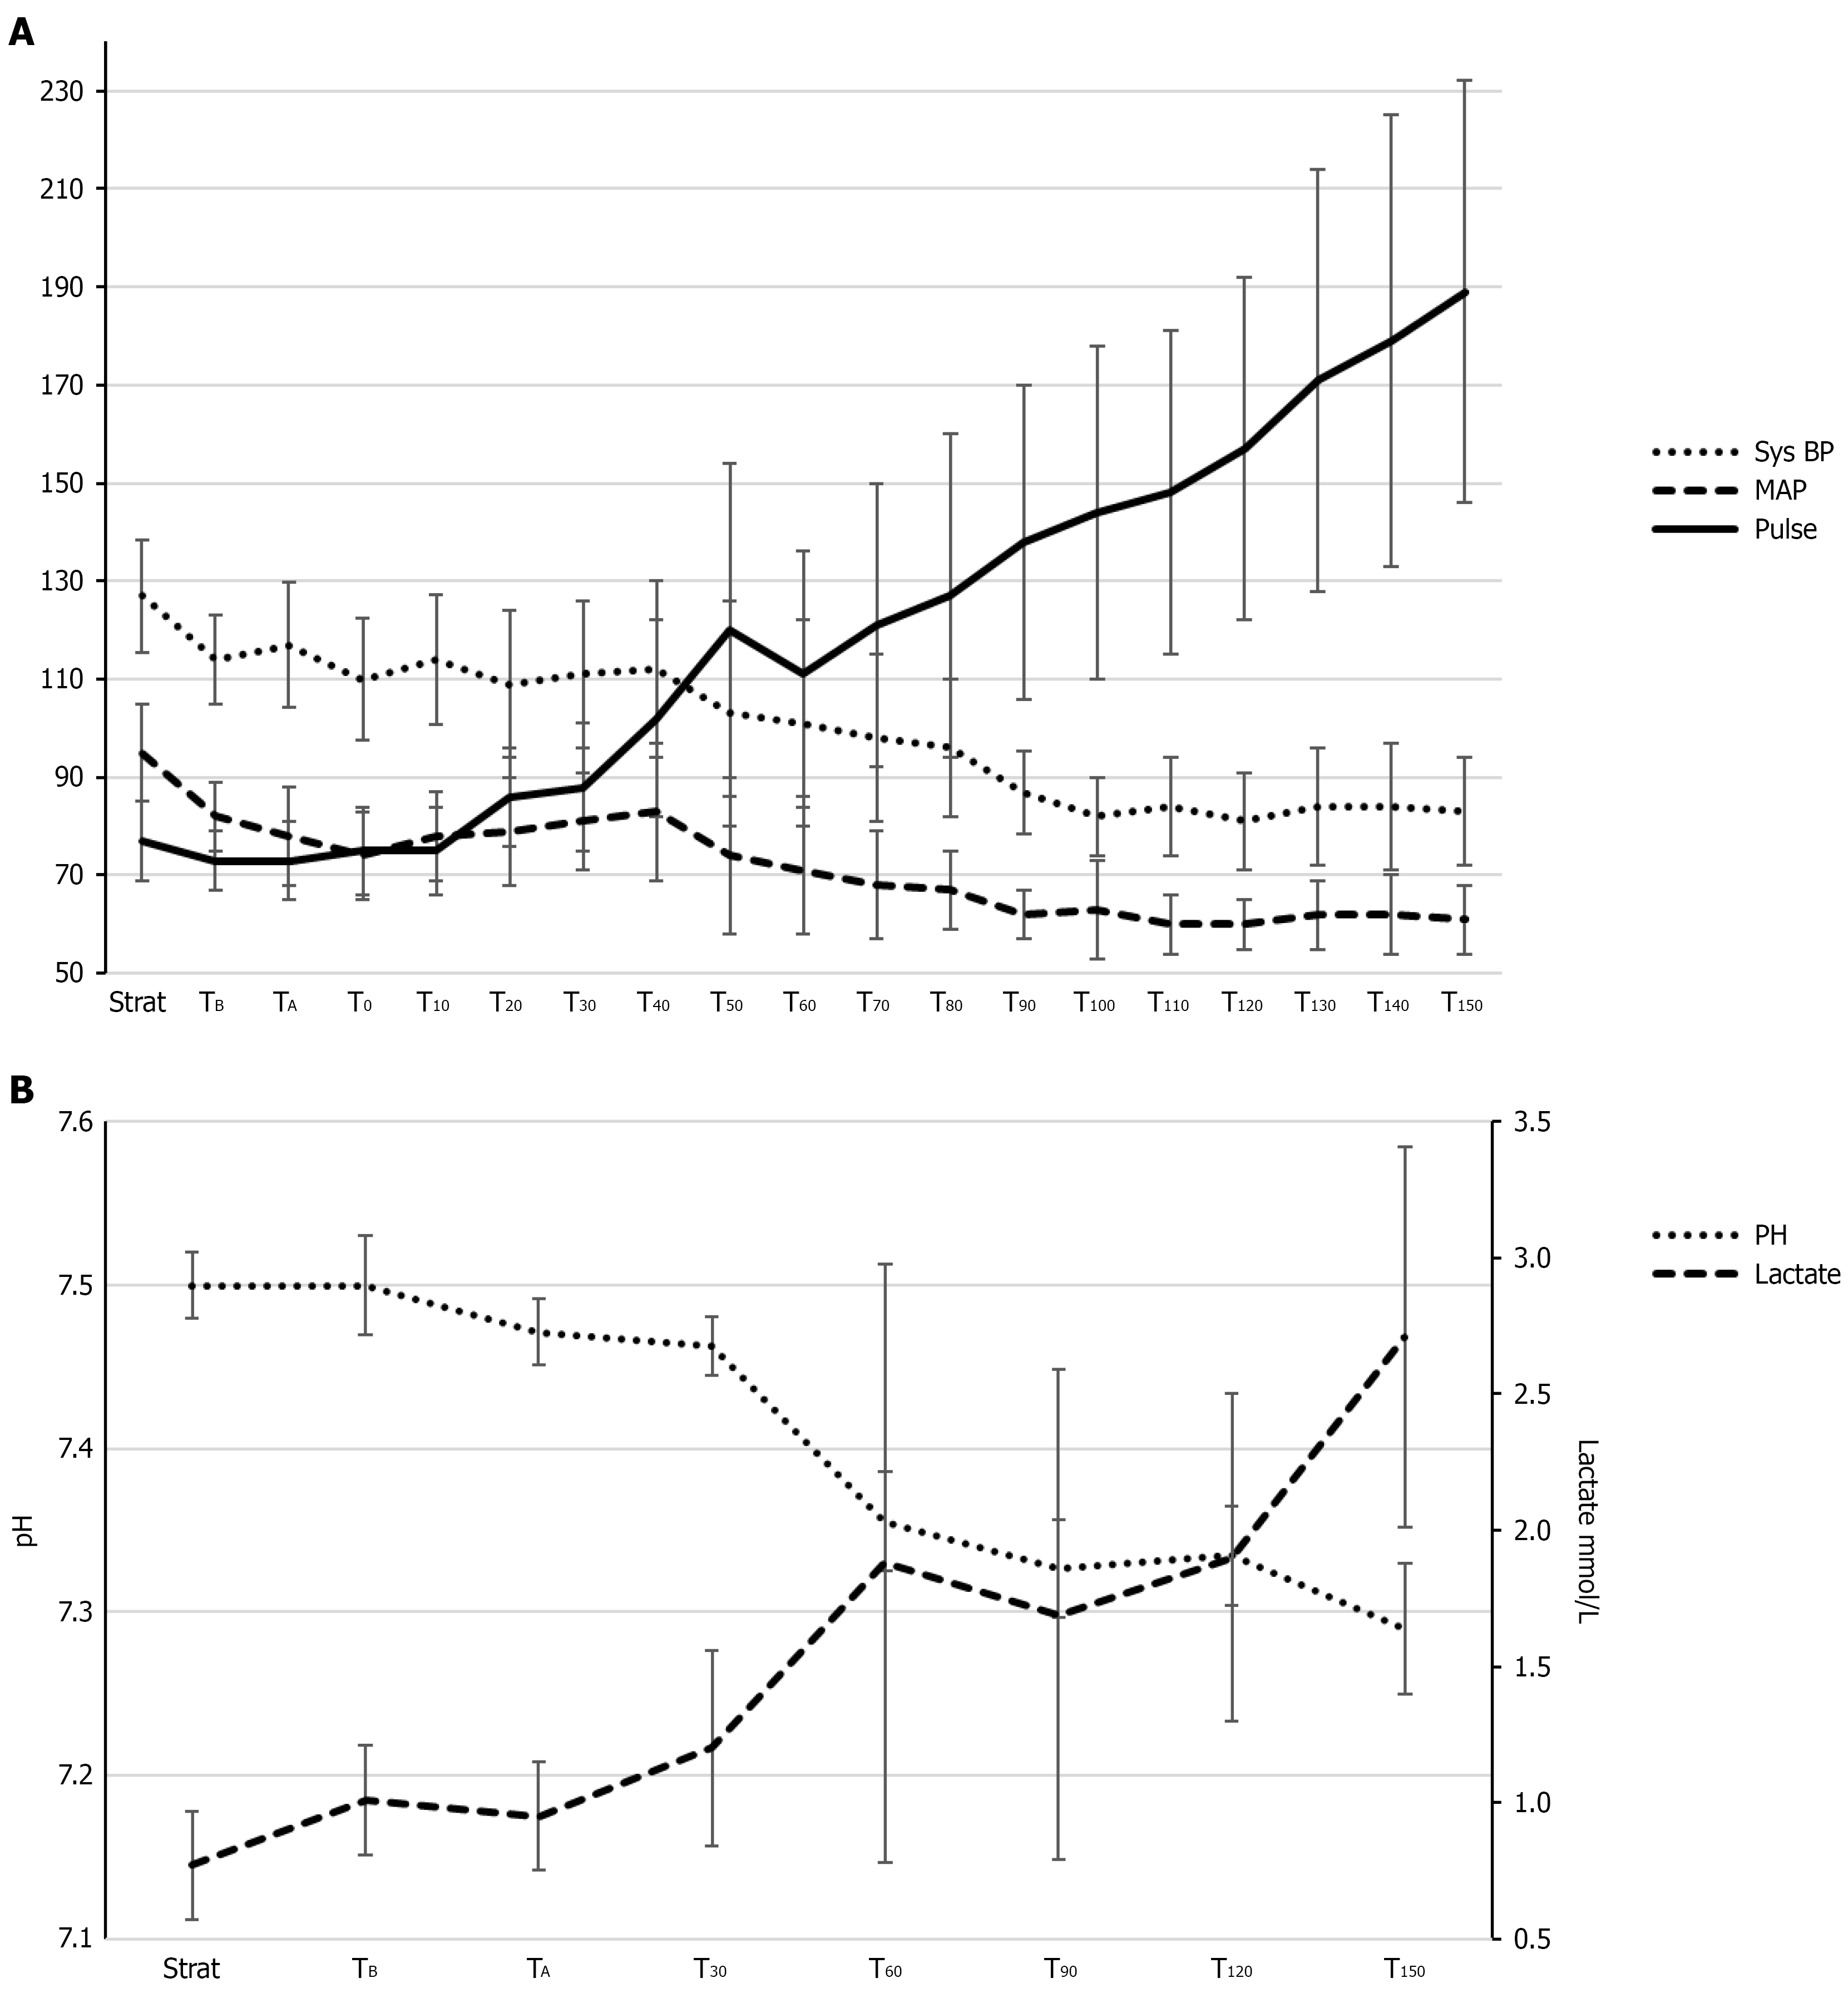
Figure 3 Hemodynamic changes and sepsis variables in the porcine model.
A: Shows the hemodynamic parameters measured throughout the experiment: Systolic blood pressure, mean arterial blood pressure, and pulse from start (right after anesthesia induction prior to surgery) to T150. Following the initiation of the Escherichia coli (E. coli) infusion (at T0), hemodynamic parameters were recorded every 10 minutes. The Y-axis represents values in mmHg (for blood pressure and mean arterial pressure), beats per minute (for pulse). Whiskers represent SD; B: Illustrates the progression of pH and lactate levels throughout the duration of the experiment. The graph shows the mean value ± SD (whiskers). X-axis represents time points: Start = After induced anesthesia and prior to surgery; TB = Baseline measurements; TA = Immediately after anastomosis formation; T30, T60, T90, T120, T150 = Measurements taken during E. coli infusion/sepsis, number indicates minutes from start of E. coli infusion. The Y-axis represents lactate levels in mmol/L, or pH values. SysBP: Systolic blood pressure; MAP: Mean arterial pressure; E. coli: Escherichia coli.
- Citation: Paramasivam R, Jaensch C, Kristensen NM, Paramasivam SS, Woldeselassie H, Jensen LK, Madsen AH, Ørntoft MBW. Septic shock reduces intestinal microcirculation and anastomotic perfusion: A porcine laser speckle contrast imaging study. World J Gastrointest Surg 2026; 18(1): 111928
- URL: https://www.wjgnet.com/1948-9366/full/v18/i1/111928.htm
- DOI: https://dx.doi.org/10.4240/wjgs.v18.i1.111928