
















©The Author(s) 2025.
World J Gastrointest Surg. Sep 27, 2025; 17(9): 109521
Published online Sep 27, 2025. doi: 10.4240/wjgs.v17.i9.109521
Published online Sep 27, 2025. doi: 10.4240/wjgs.v17.i9.109521
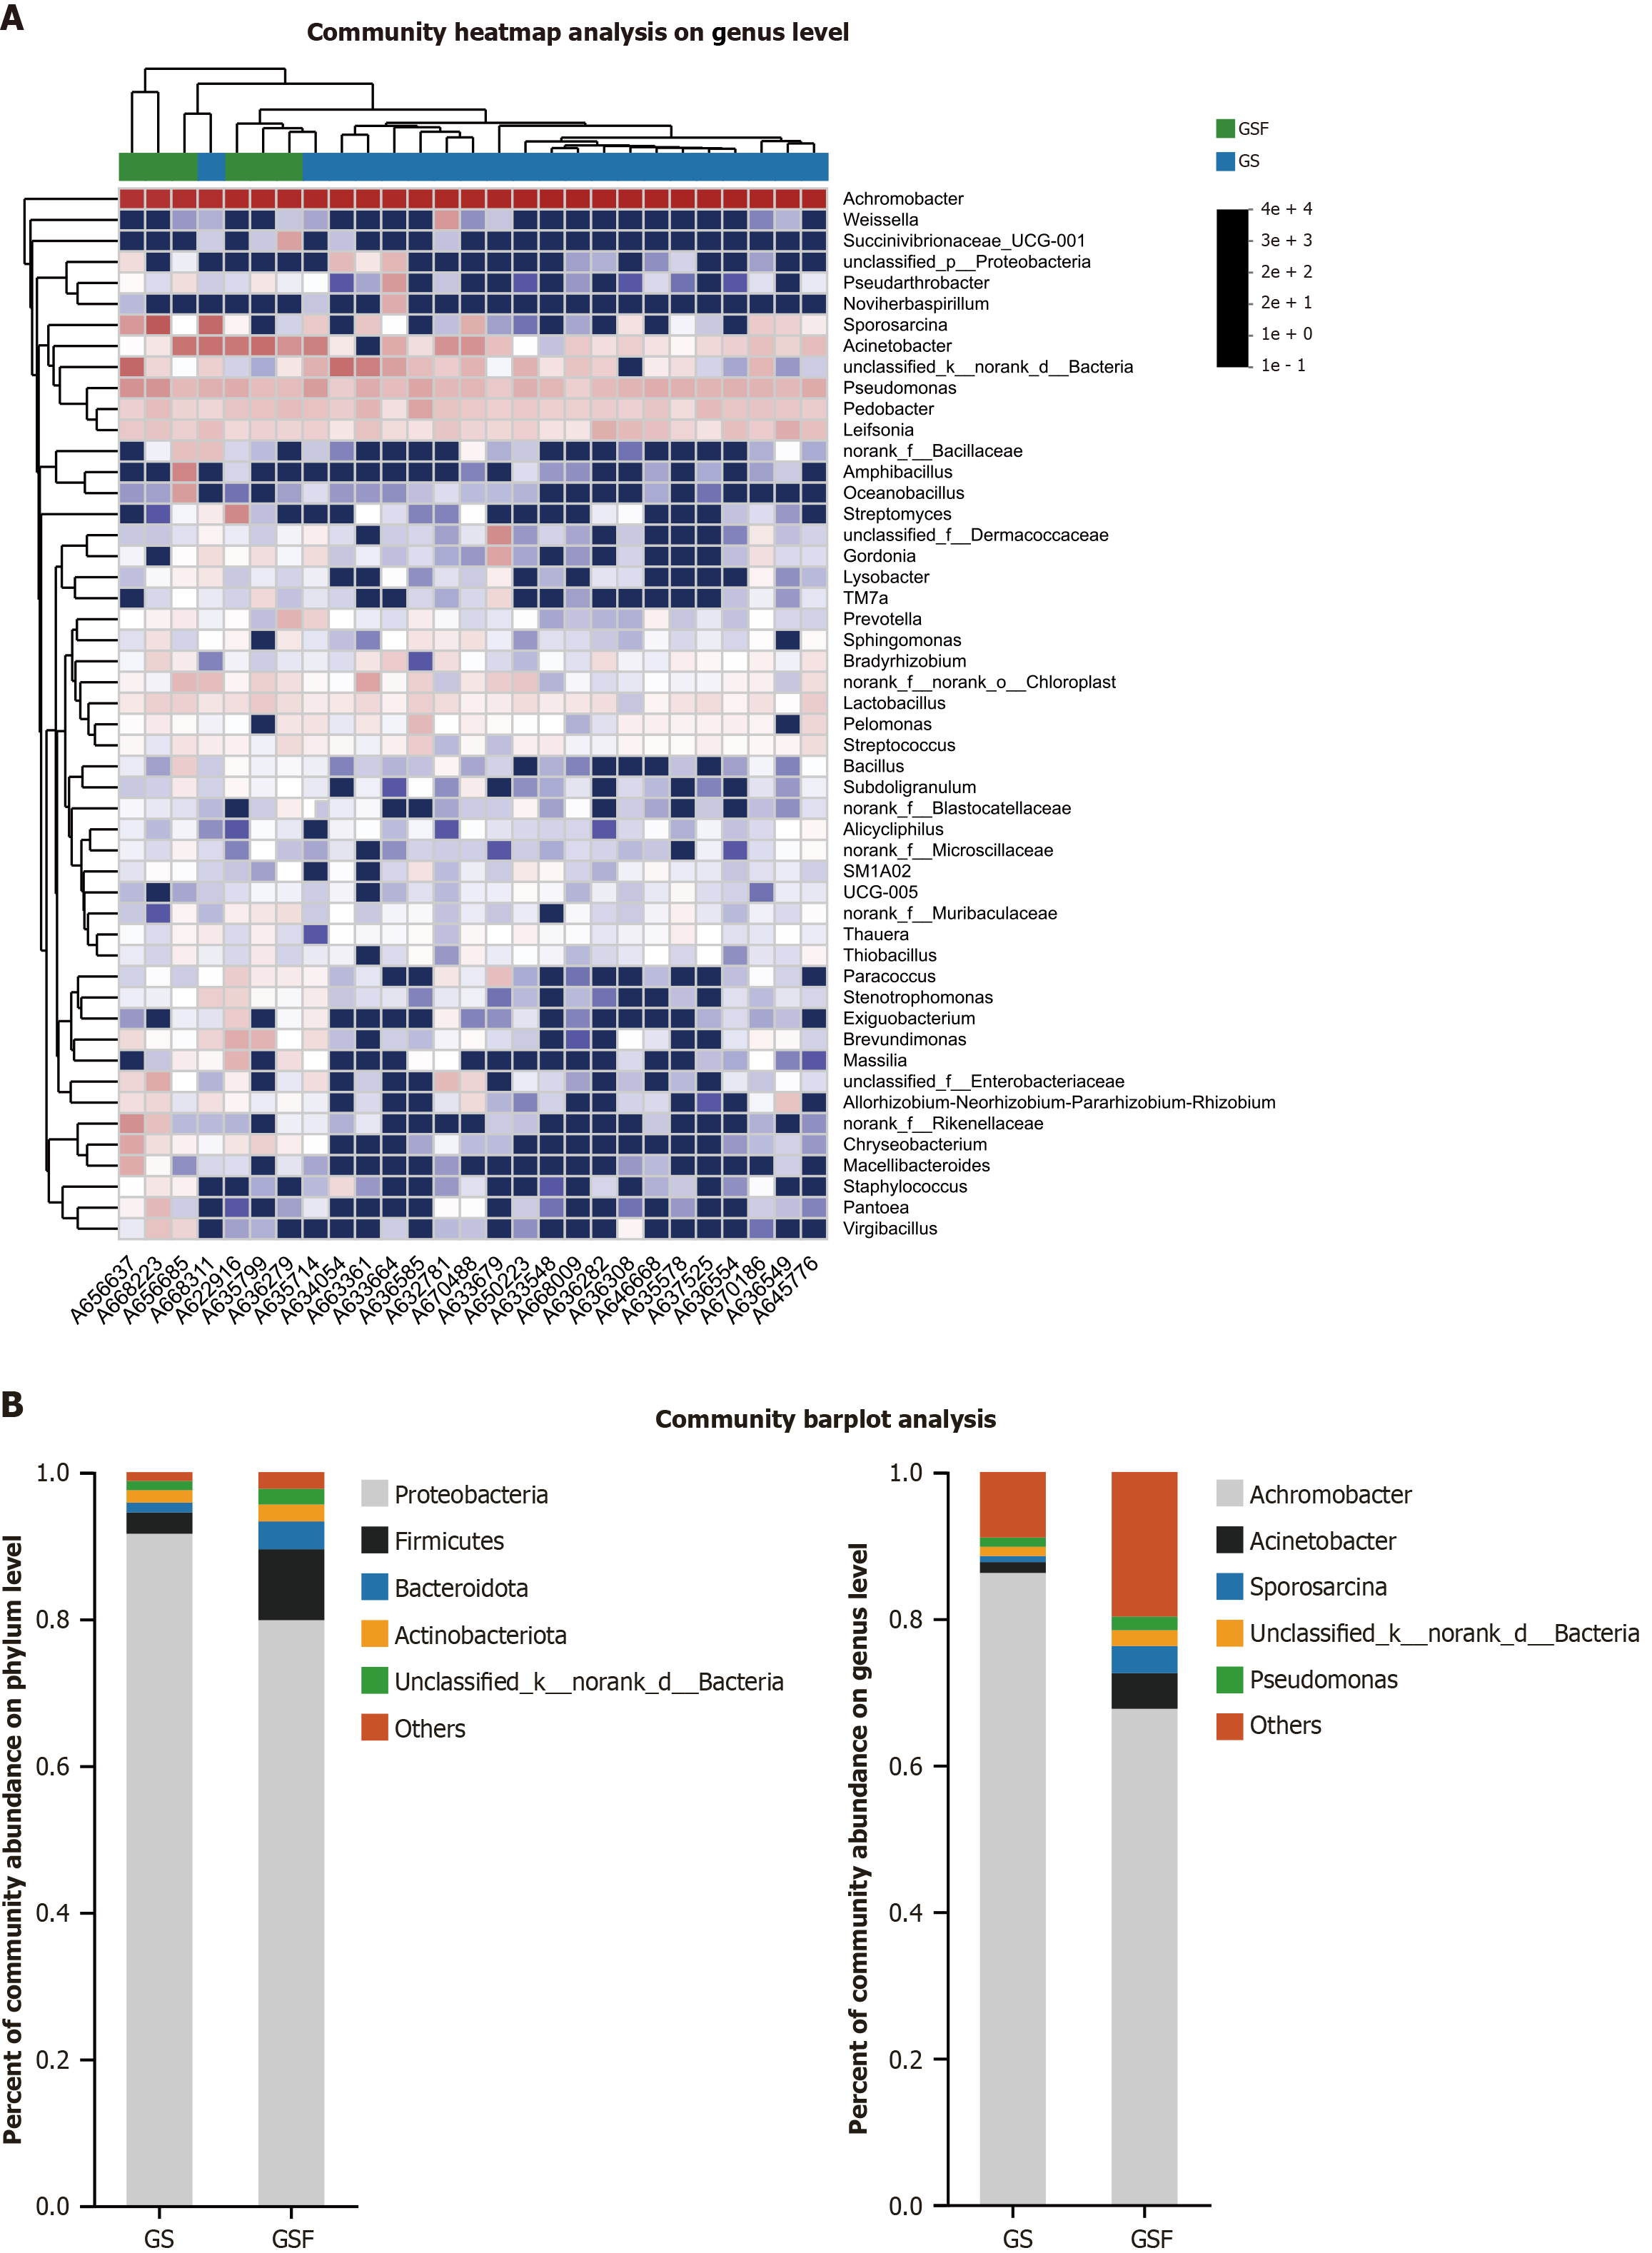
Figure 3 Analysis of the composition of bile microorganisms.
A: Community heatmap analysis at genus level, the red part indicates that the abundance of the genus in this sample is higher than other samples; the blue part represents the lower abundance of the genus in this sample than in other samples; B: Community barplot analysis at Phylum and Genus level. GS: Gallstone; GSF: Gallstone-free.
- Citation: Lu ZX, Jiang YQ, Wang DS, Song YT, Jiang XM, Xu FJ, Tang J, Li B, Huang WH. Gallstone and bile microbiota: A case-control study based on 16S rRNA gene sequencing. World J Gastrointest Surg 2025; 17(9): 109521
- URL: https://www.wjgnet.com/1948-9366/full/v17/i9/109521.htm
- DOI: https://dx.doi.org/10.4240/wjgs.v17.i9.109521