
















©The Author(s) 2025.
World J Gastrointest Surg. Sep 27, 2025; 17(9): 109521
Published online Sep 27, 2025. doi: 10.4240/wjgs.v17.i9.109521
Published online Sep 27, 2025. doi: 10.4240/wjgs.v17.i9.109521
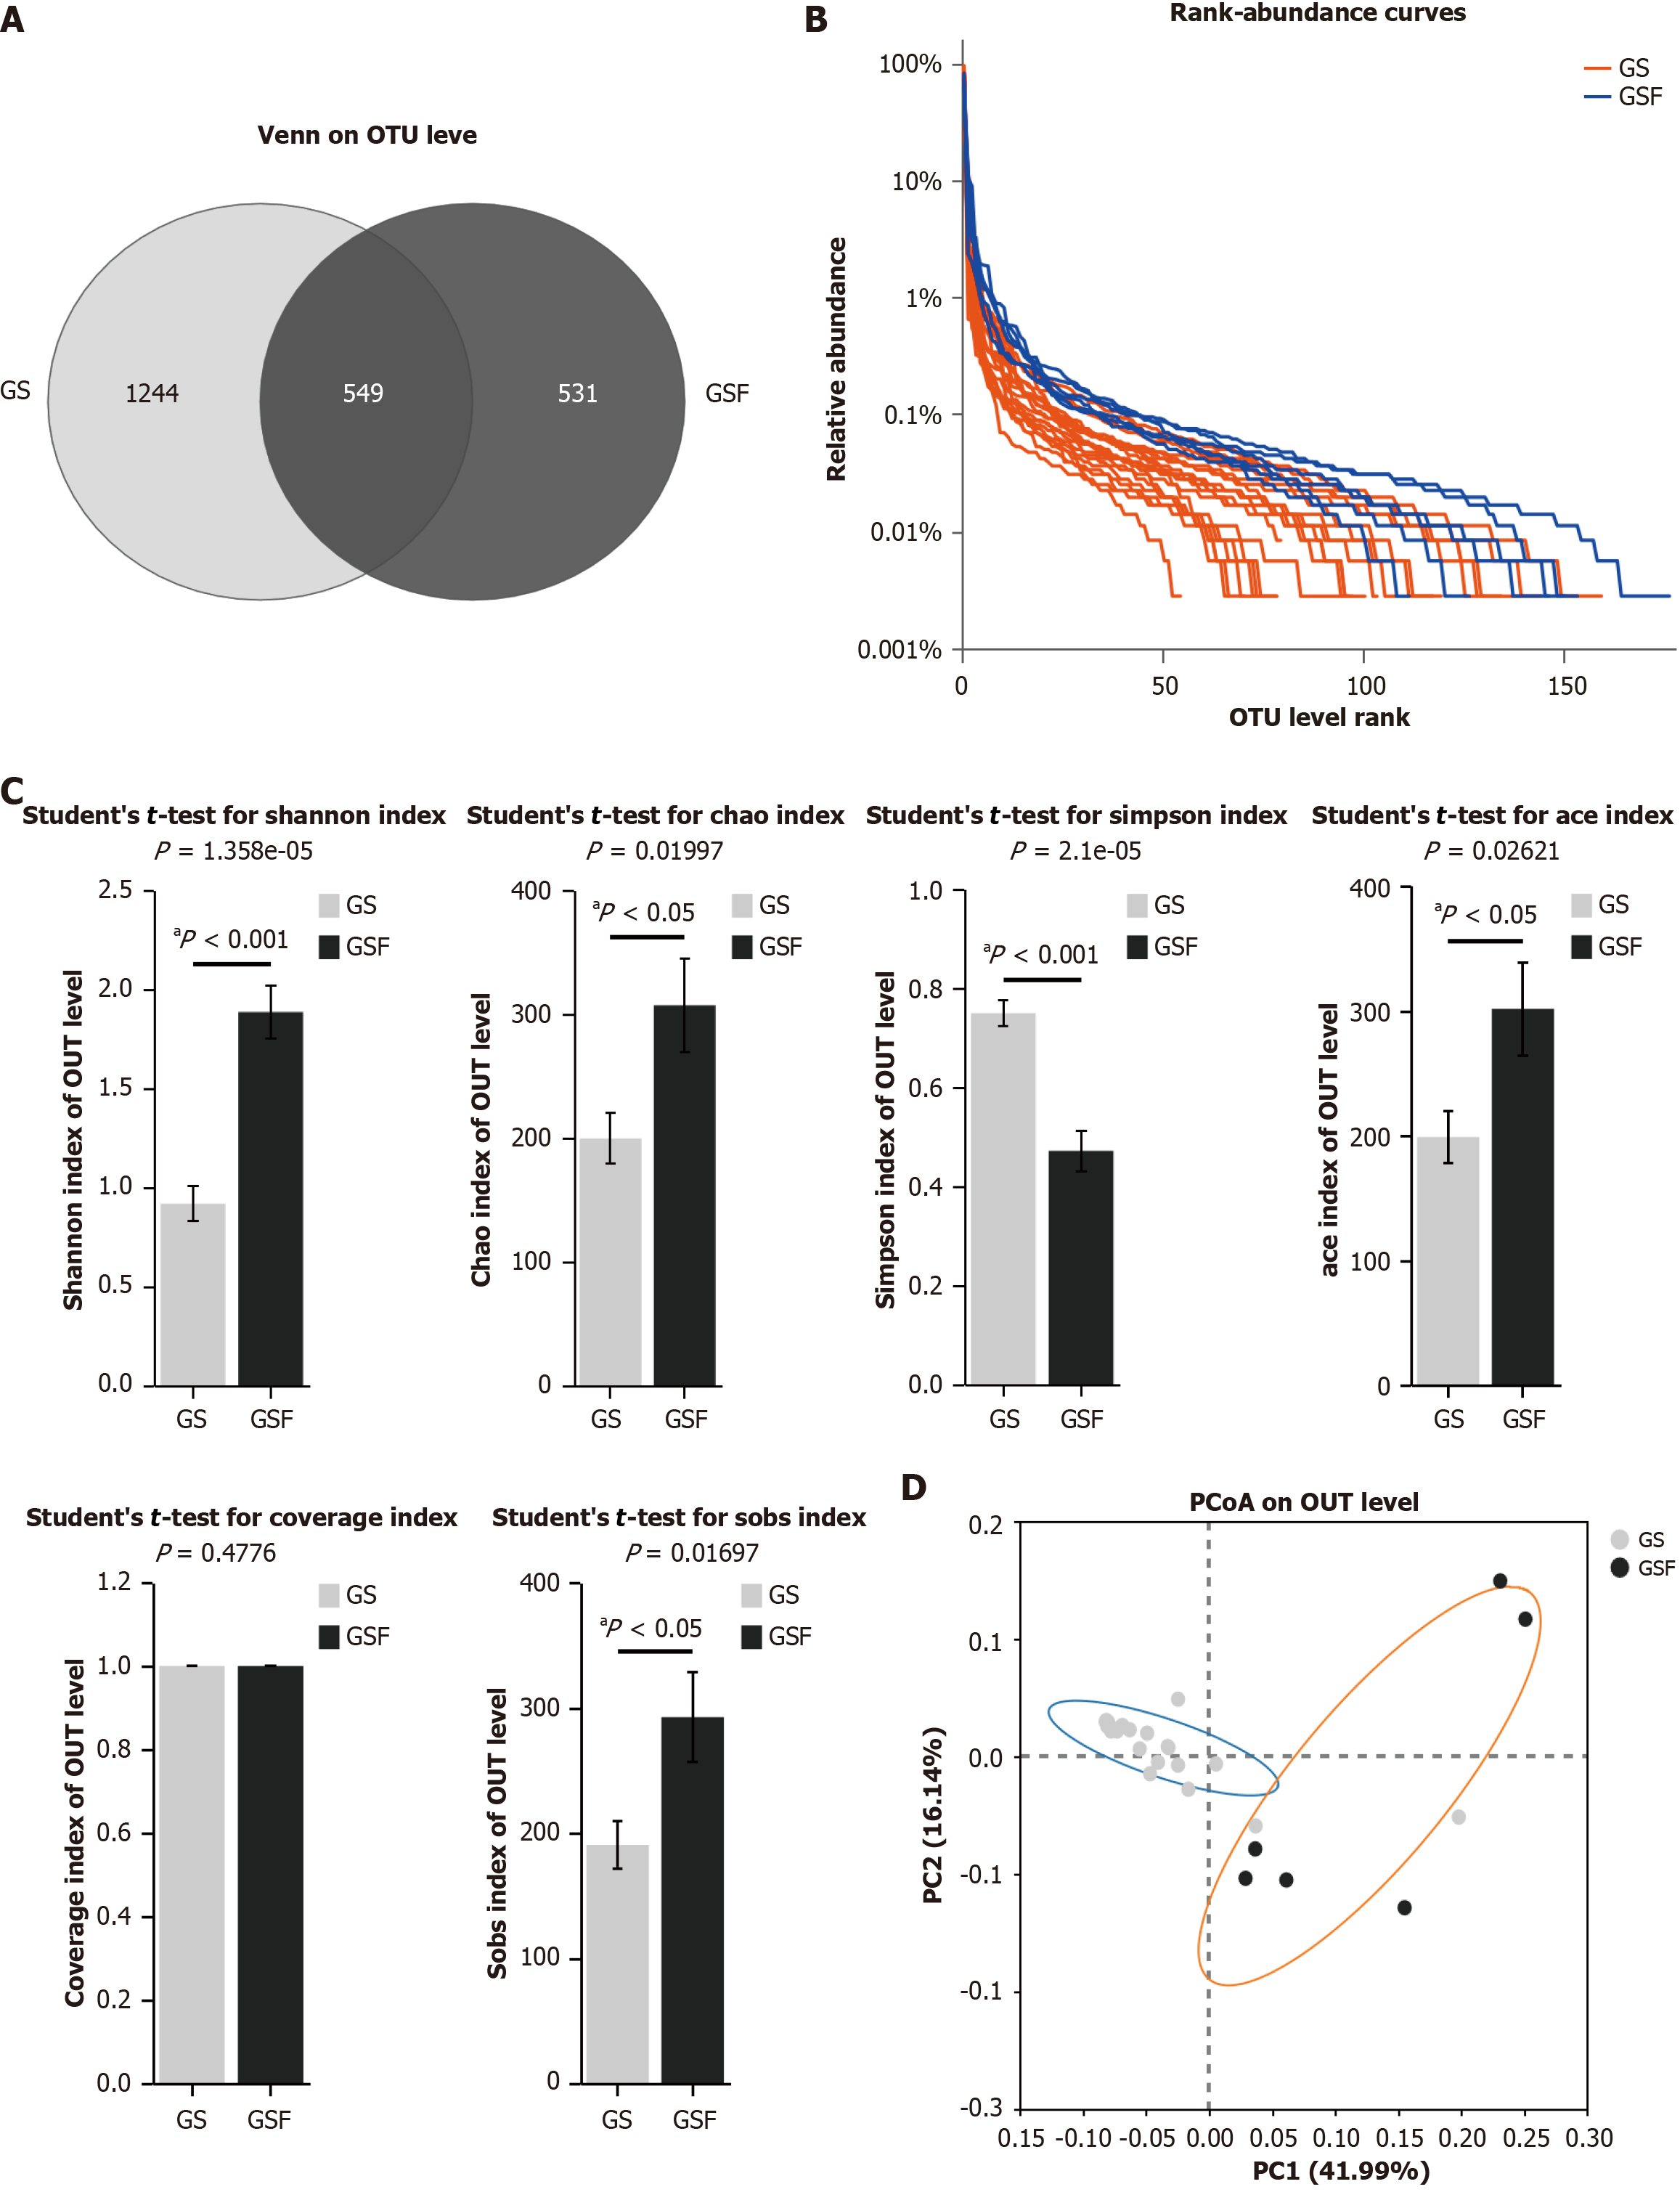
Figure 2 Analysis of 16S rRNA gene sequences and bile microbiome diversity.
Statistical significance vs the control was defined as a two-tailed aP < 0.05. A: Venn on operational taxonomic units level; B: Rank-Abundance curves on operational taxonomic units level; C: Alpha diversity analysis of bile microbiome including Shannon, Chao, Simpson, Ace, Coverage, and Sobs index; D: Beta diversity analysis of bile microbiome. OUT: Operational taxonomic units; GS: Gallstone; GSF: Gallstone-free; PCoA: Principal coordinate analysis; PC1: Principal component 1; PC2: Principal component 2.
- Citation: Lu ZX, Jiang YQ, Wang DS, Song YT, Jiang XM, Xu FJ, Tang J, Li B, Huang WH. Gallstone and bile microbiota: A case-control study based on 16S rRNA gene sequencing. World J Gastrointest Surg 2025; 17(9): 109521
- URL: https://www.wjgnet.com/1948-9366/full/v17/i9/109521.htm
- DOI: https://dx.doi.org/10.4240/wjgs.v17.i9.109521