
















©The Author(s) 2025.
World J Gastrointest Surg. Sep 27, 2025; 17(9): 107977
Published online Sep 27, 2025. doi: 10.4240/wjgs.v17.i9.107977
Published online Sep 27, 2025. doi: 10.4240/wjgs.v17.i9.107977
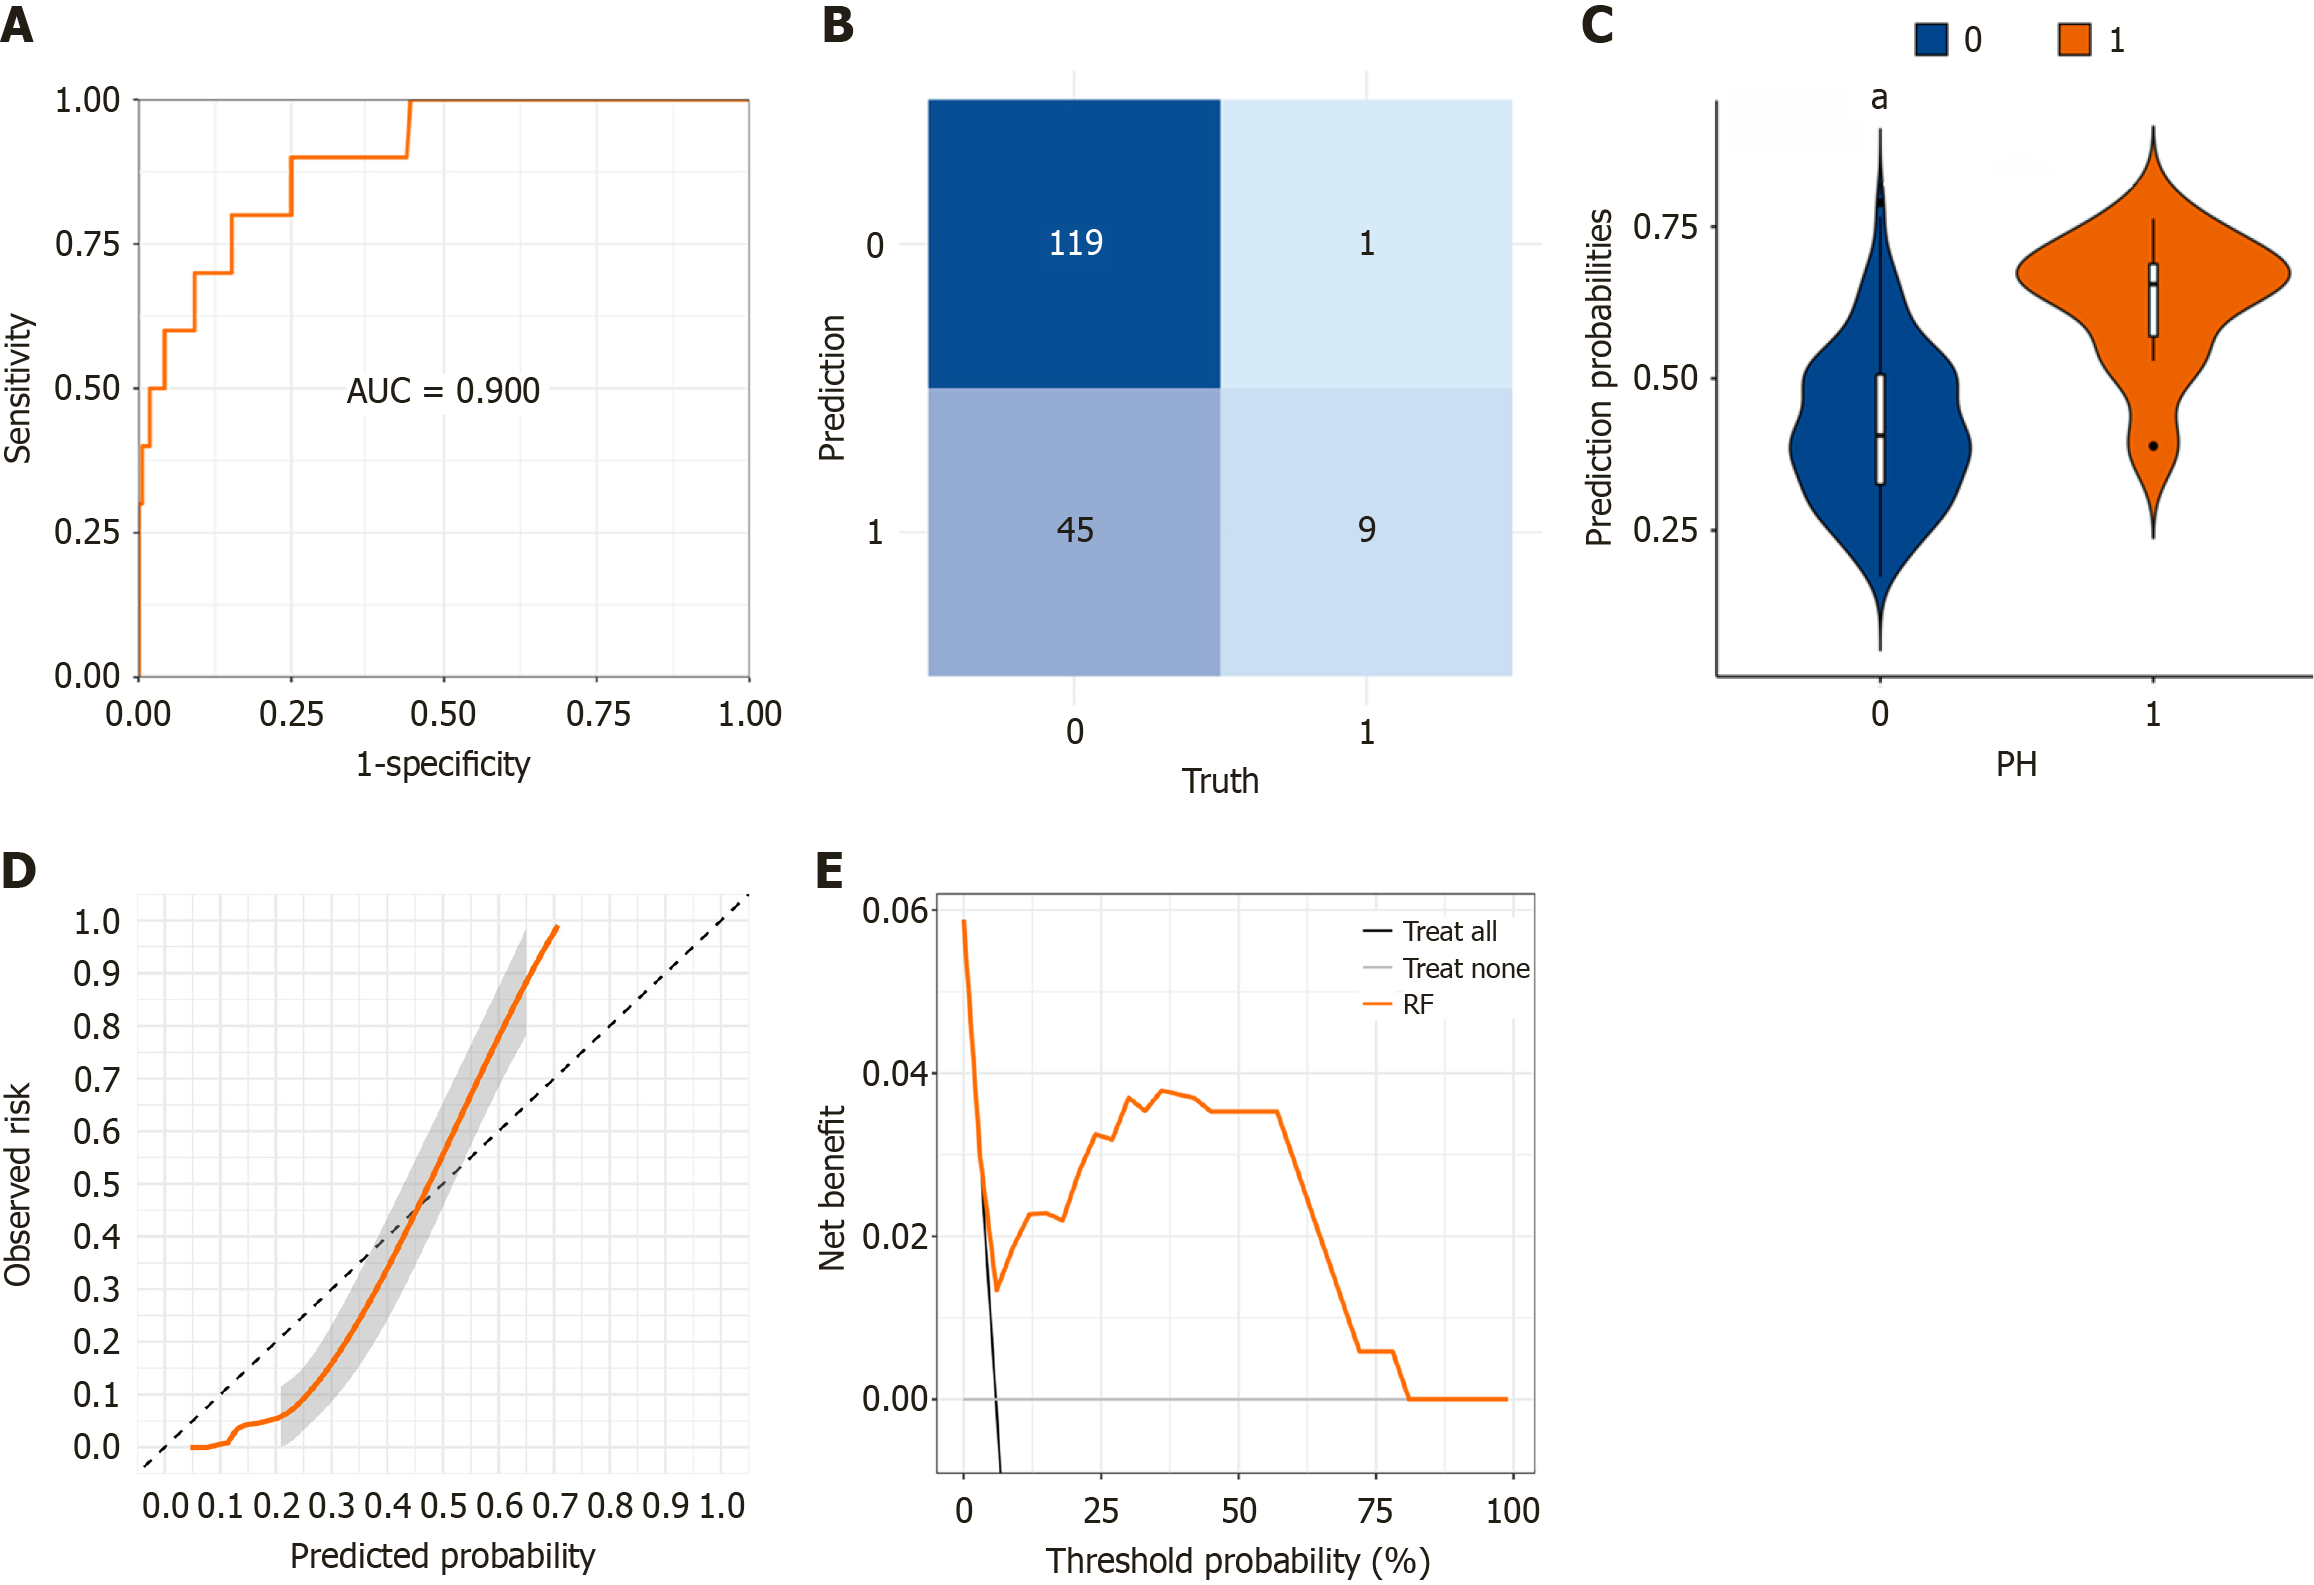
Figure 2 Evaluation of the random forest model in the test cohort.
A: Receiver operating characteristic curves and area under the curve values for the testing set; B: Confusion matrix for the random forest (RF) model applied to the testing set; C: Comparison of predicted probabilities by the RF model for patients with and without parastomal hernia in the test cohort; D: Decision curve analysis for the test group; E: Calibration curve of the testing set. aP < 0.001 vs control group. AUC: Area under the curve.
- Citation: Yang WS, Su Y, Li YQ, Hu JB, Liu MD, Liu L. Prediction of parastomal hernia in patients undergoing preventive ostomy after rectal cancer resection using machine learning. World J Gastrointest Surg 2025; 17(9): 107977
- URL: https://www.wjgnet.com/1948-9366/full/v17/i9/107977.htm
- DOI: https://dx.doi.org/10.4240/wjgs.v17.i9.107977