Copyright
©The Author(s) 2025.
World J Gastrointest Surg. Jul 27, 2025; 17(7): 107804
Published online Jul 27, 2025. doi: 10.4240/wjgs.v17.i7.107804
Published online Jul 27, 2025. doi: 10.4240/wjgs.v17.i7.107804
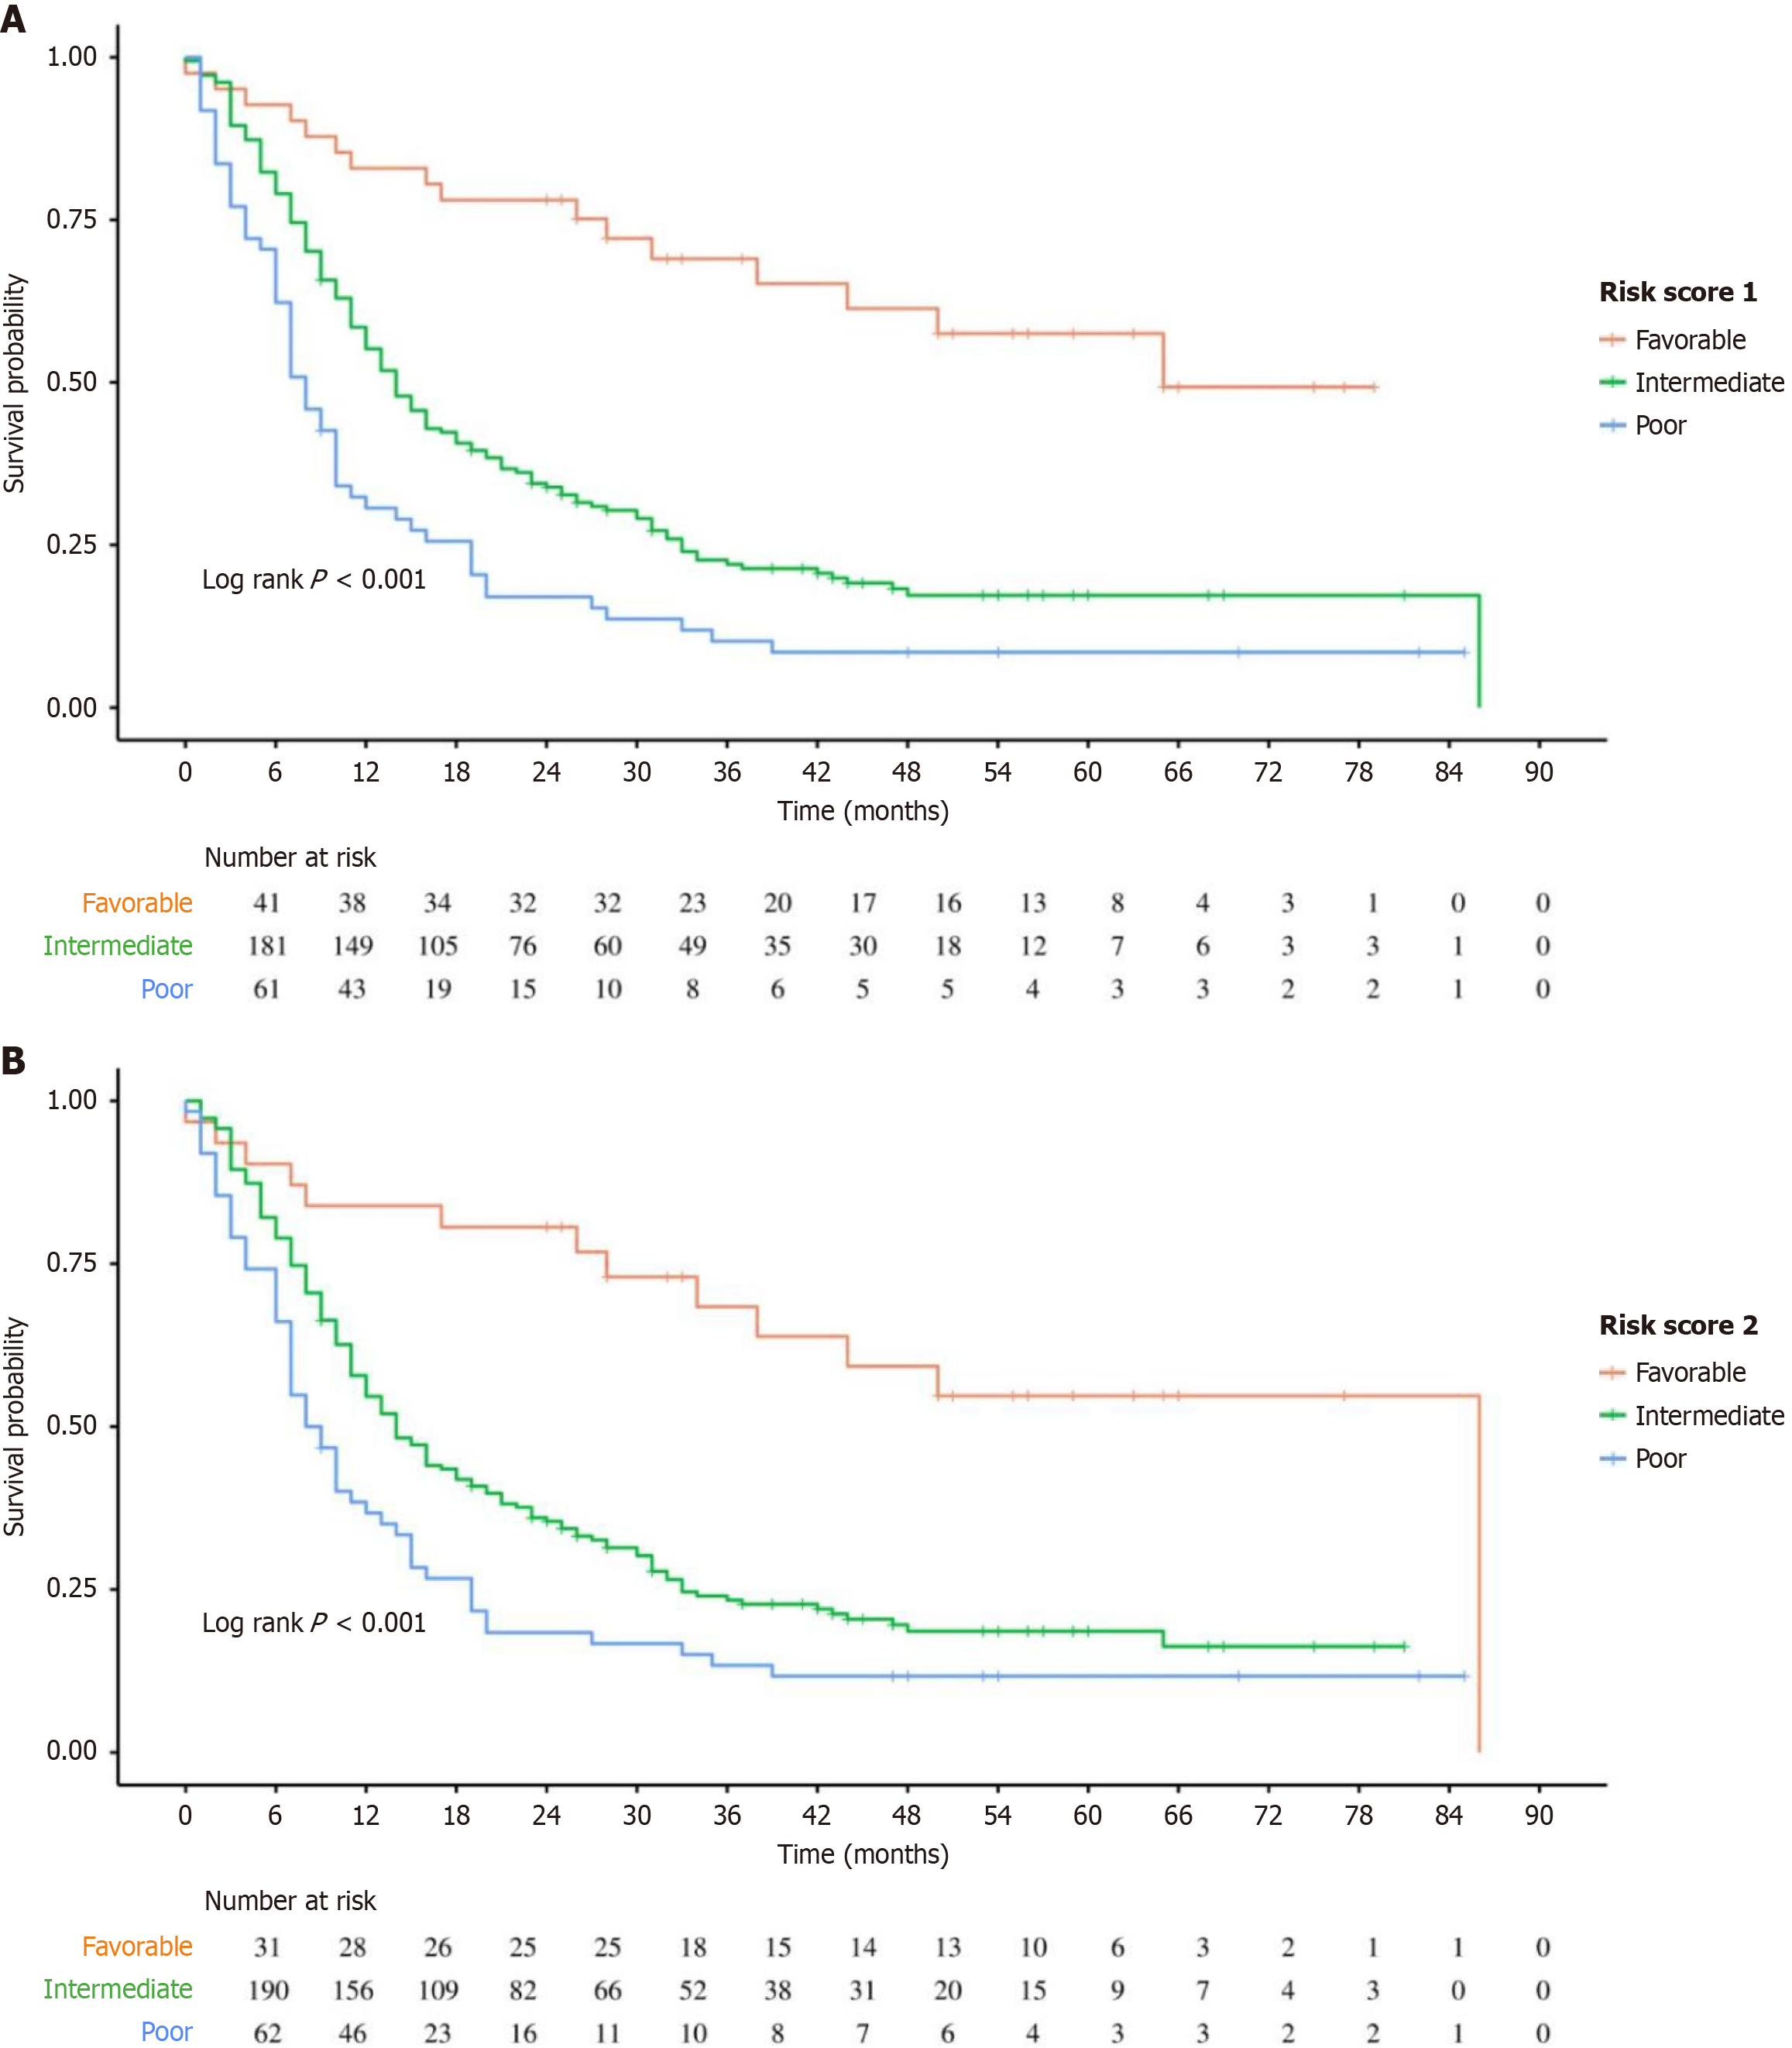
Figure 1 Kaplan Meier survival curves for patients stratified by risk group.
The low-risk group showed significantly better survival outcomes than the moderate and high-risk groups, whereas the high-risk group exhibited the poorest prognosis. Differences in survival among the groups were statistically significant (log-rank test, P < 0.001), indicating the predictive value of the risk score for patient prognosis. A: Risk score 1 from Reader 1; B: Risk score 2 from Reader 2.
- Citation: Liu XH, Xie JH, Zhu XS, Liu LH. Preoperative computed tomography-based risk stratification model validation for postoperative pancreatic ductal adenocarcinoma recurrence. World J Gastrointest Surg 2025; 17(7): 107804
- URL: https://www.wjgnet.com/1948-9366/full/v17/i7/107804.htm
- DOI: https://dx.doi.org/10.4240/wjgs.v17.i7.107804


