Copyright
©The Author(s) 2025.
World J Gastrointest Surg. Jul 27, 2025; 17(7): 105956
Published online Jul 27, 2025. doi: 10.4240/wjgs.v17.i7.105956
Published online Jul 27, 2025. doi: 10.4240/wjgs.v17.i7.105956
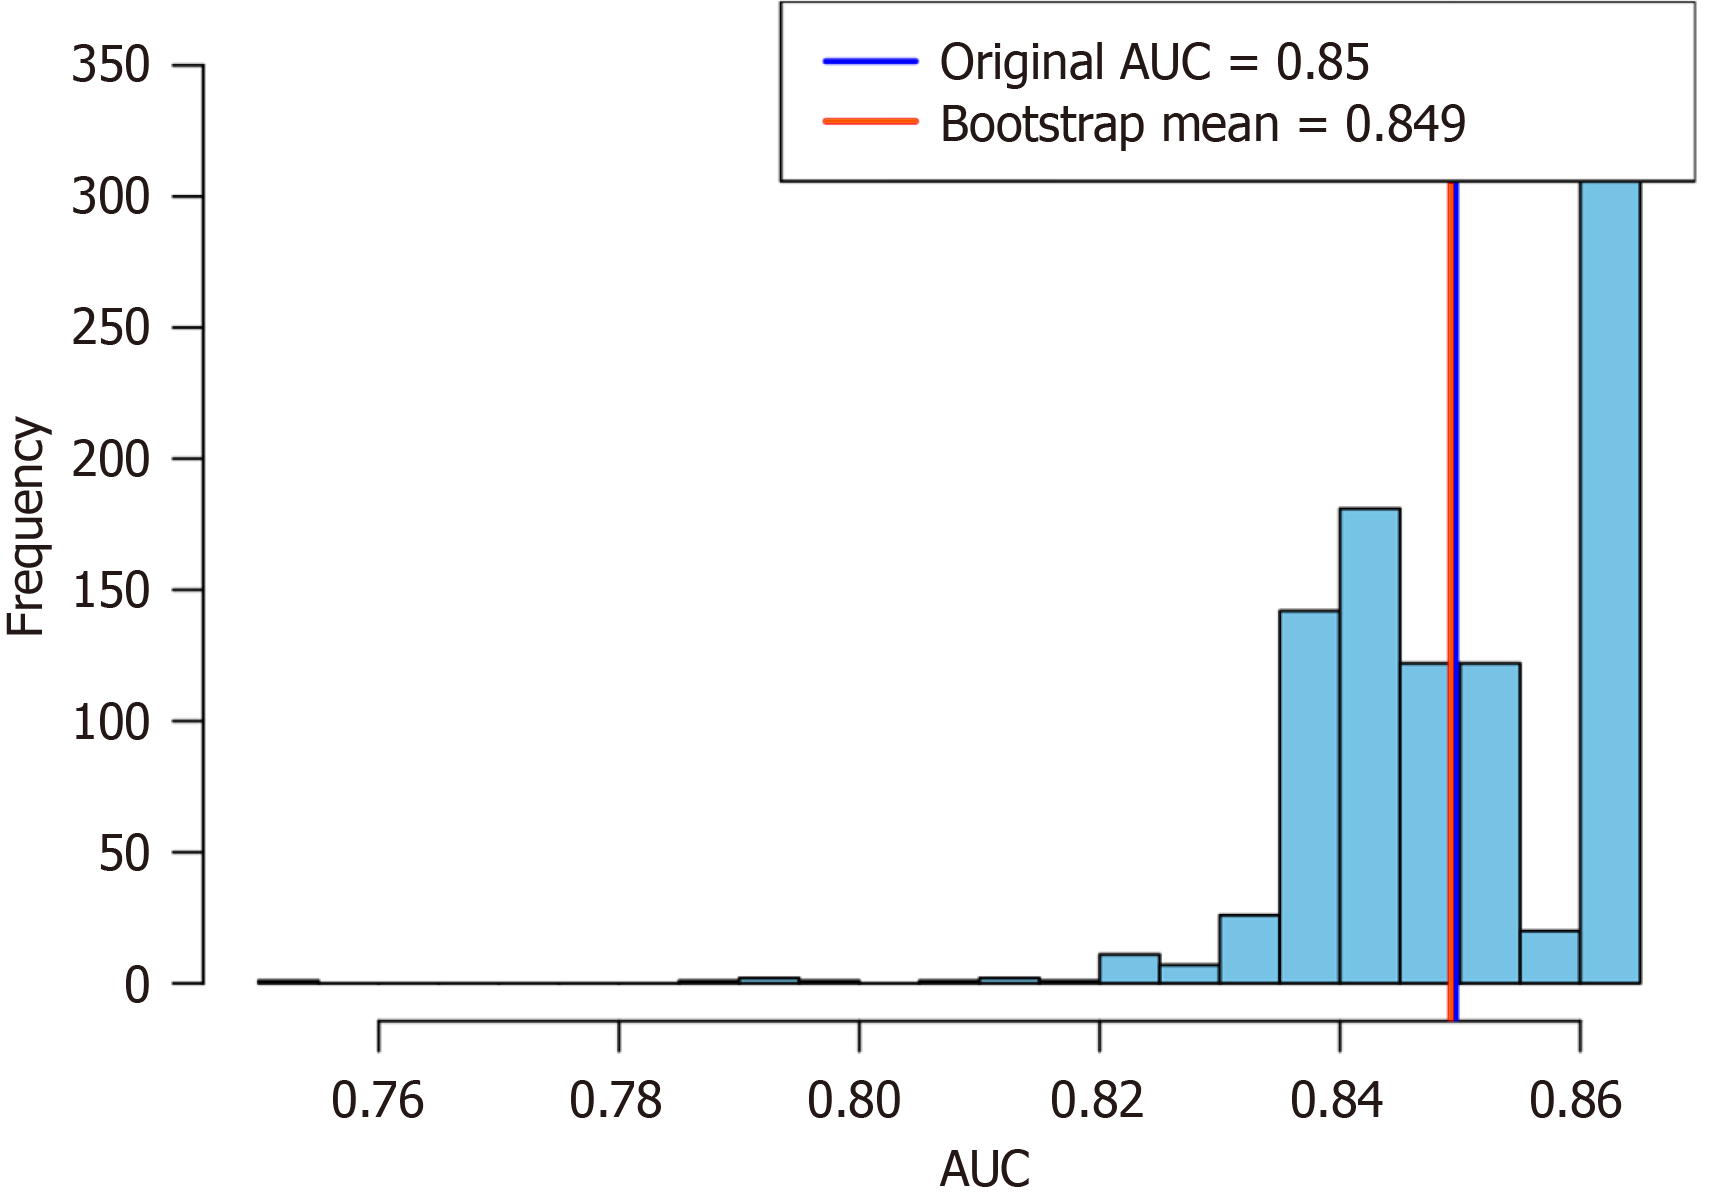
Figure 5 A histogram depicting the area under the curve distribution from the bootstrap analysis (1000 iterations) revealed an original area under the curve of 0.
894 and a mean area under the curve of 0.888. AUC: Area under the curve.
- Citation: Yang JS, Xu ZY, Chen FX, Wang MR, Fan XL, He BS. Diagnostic value of dual-energy computed tomography in irreversible transmural intestinal necrosis in patients with acute occlusive mesenteric ischemia. World J Gastrointest Surg 2025; 17(7): 105956
- URL: https://www.wjgnet.com/1948-9366/full/v17/i7/105956.htm
- DOI: https://dx.doi.org/10.4240/wjgs.v17.i7.105956


