Copyright
©The Author(s) 2025.
World J Gastrointest Surg. Jul 27, 2025; 17(7): 104118
Published online Jul 27, 2025. doi: 10.4240/wjgs.v17.i7.104118
Published online Jul 27, 2025. doi: 10.4240/wjgs.v17.i7.104118
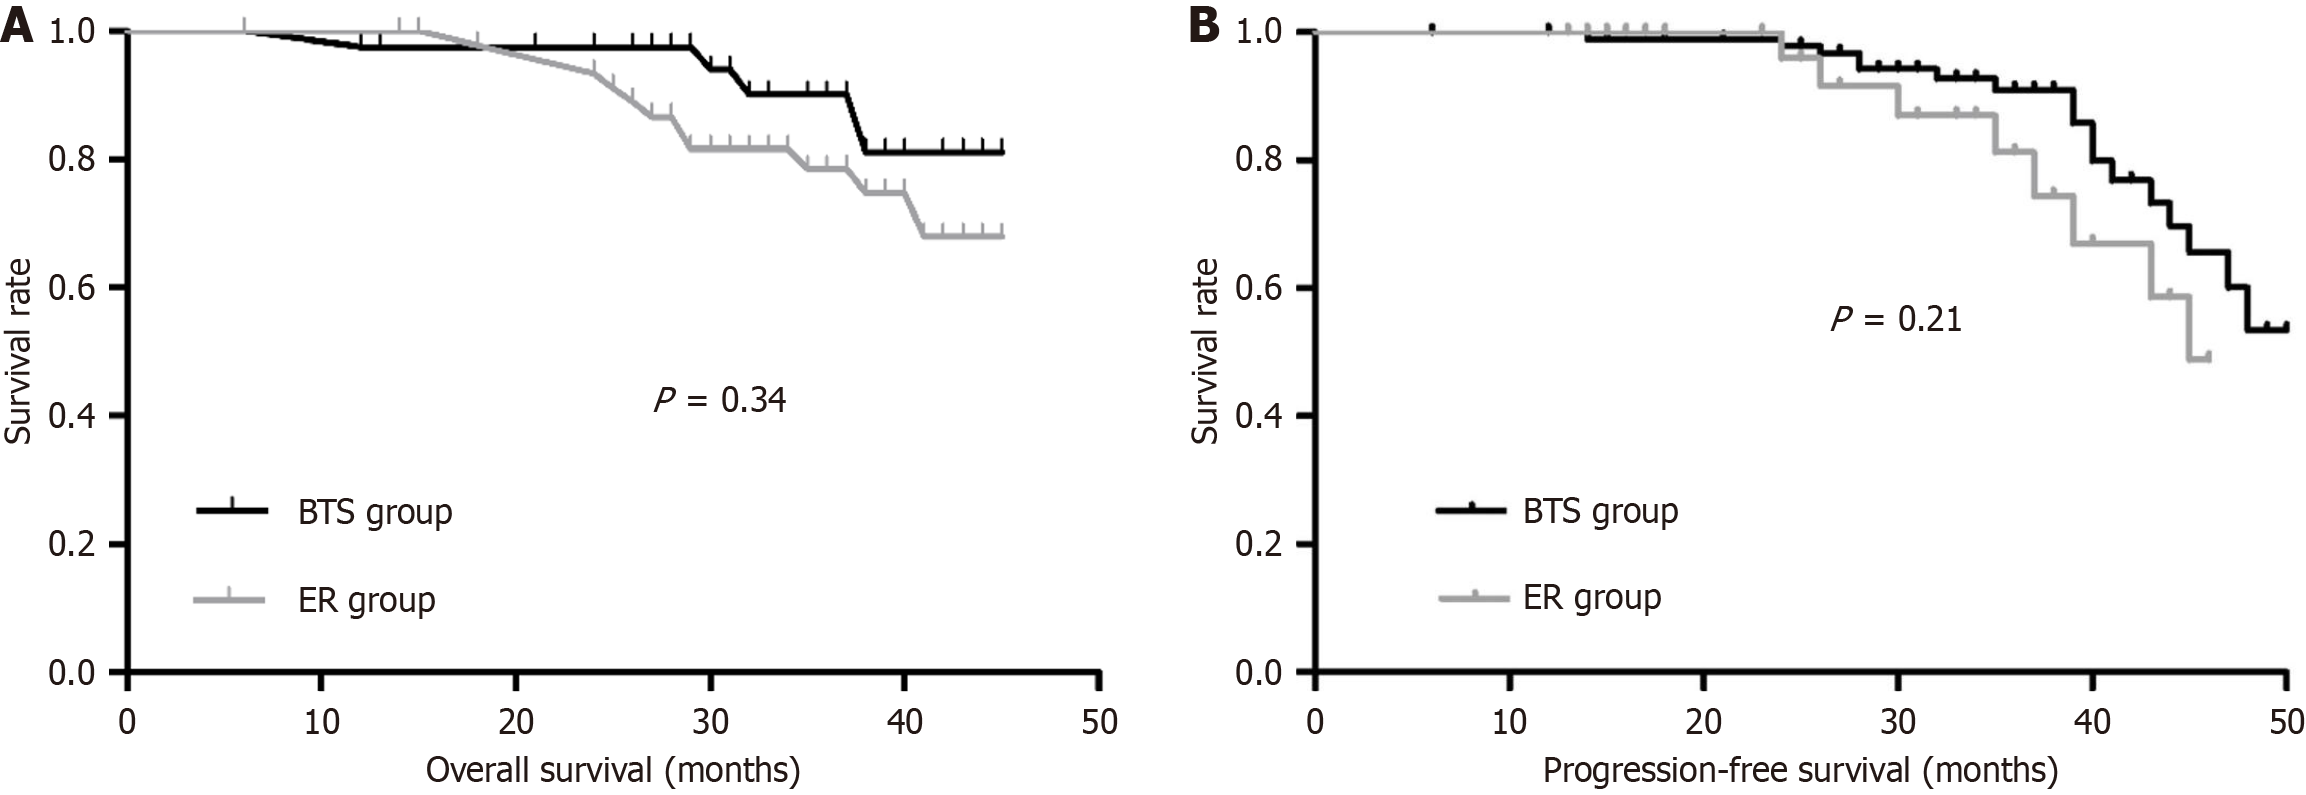
Figure 3 Kaplan-Meier curves.
A: Kaplan-Meier curves showing the overall survival in the bridge to surgery group and emergency resection group (P = 0.34); B: Kaplan-Meier curves showing the progression-free survival in the bridge to surgery group and emergency resection group (P = 0.21). BTS: Bridge to surgery; ER: Emergency resection.
- Citation: Xiao H, Ma HC. Outcomes of colonic stent as a bridge to surgery vs emergency surgery for acute obstructive left-sided colon cancer. World J Gastrointest Surg 2025; 17(7): 104118
- URL: https://www.wjgnet.com/1948-9366/full/v17/i7/104118.htm
- DOI: https://dx.doi.org/10.4240/wjgs.v17.i7.104118


