Copyright
©The Author(s) 2025.
World J Gastrointest Surg. May 27, 2025; 17(5): 105743
Published online May 27, 2025. doi: 10.4240/wjgs.v17.i5.105743
Published online May 27, 2025. doi: 10.4240/wjgs.v17.i5.105743
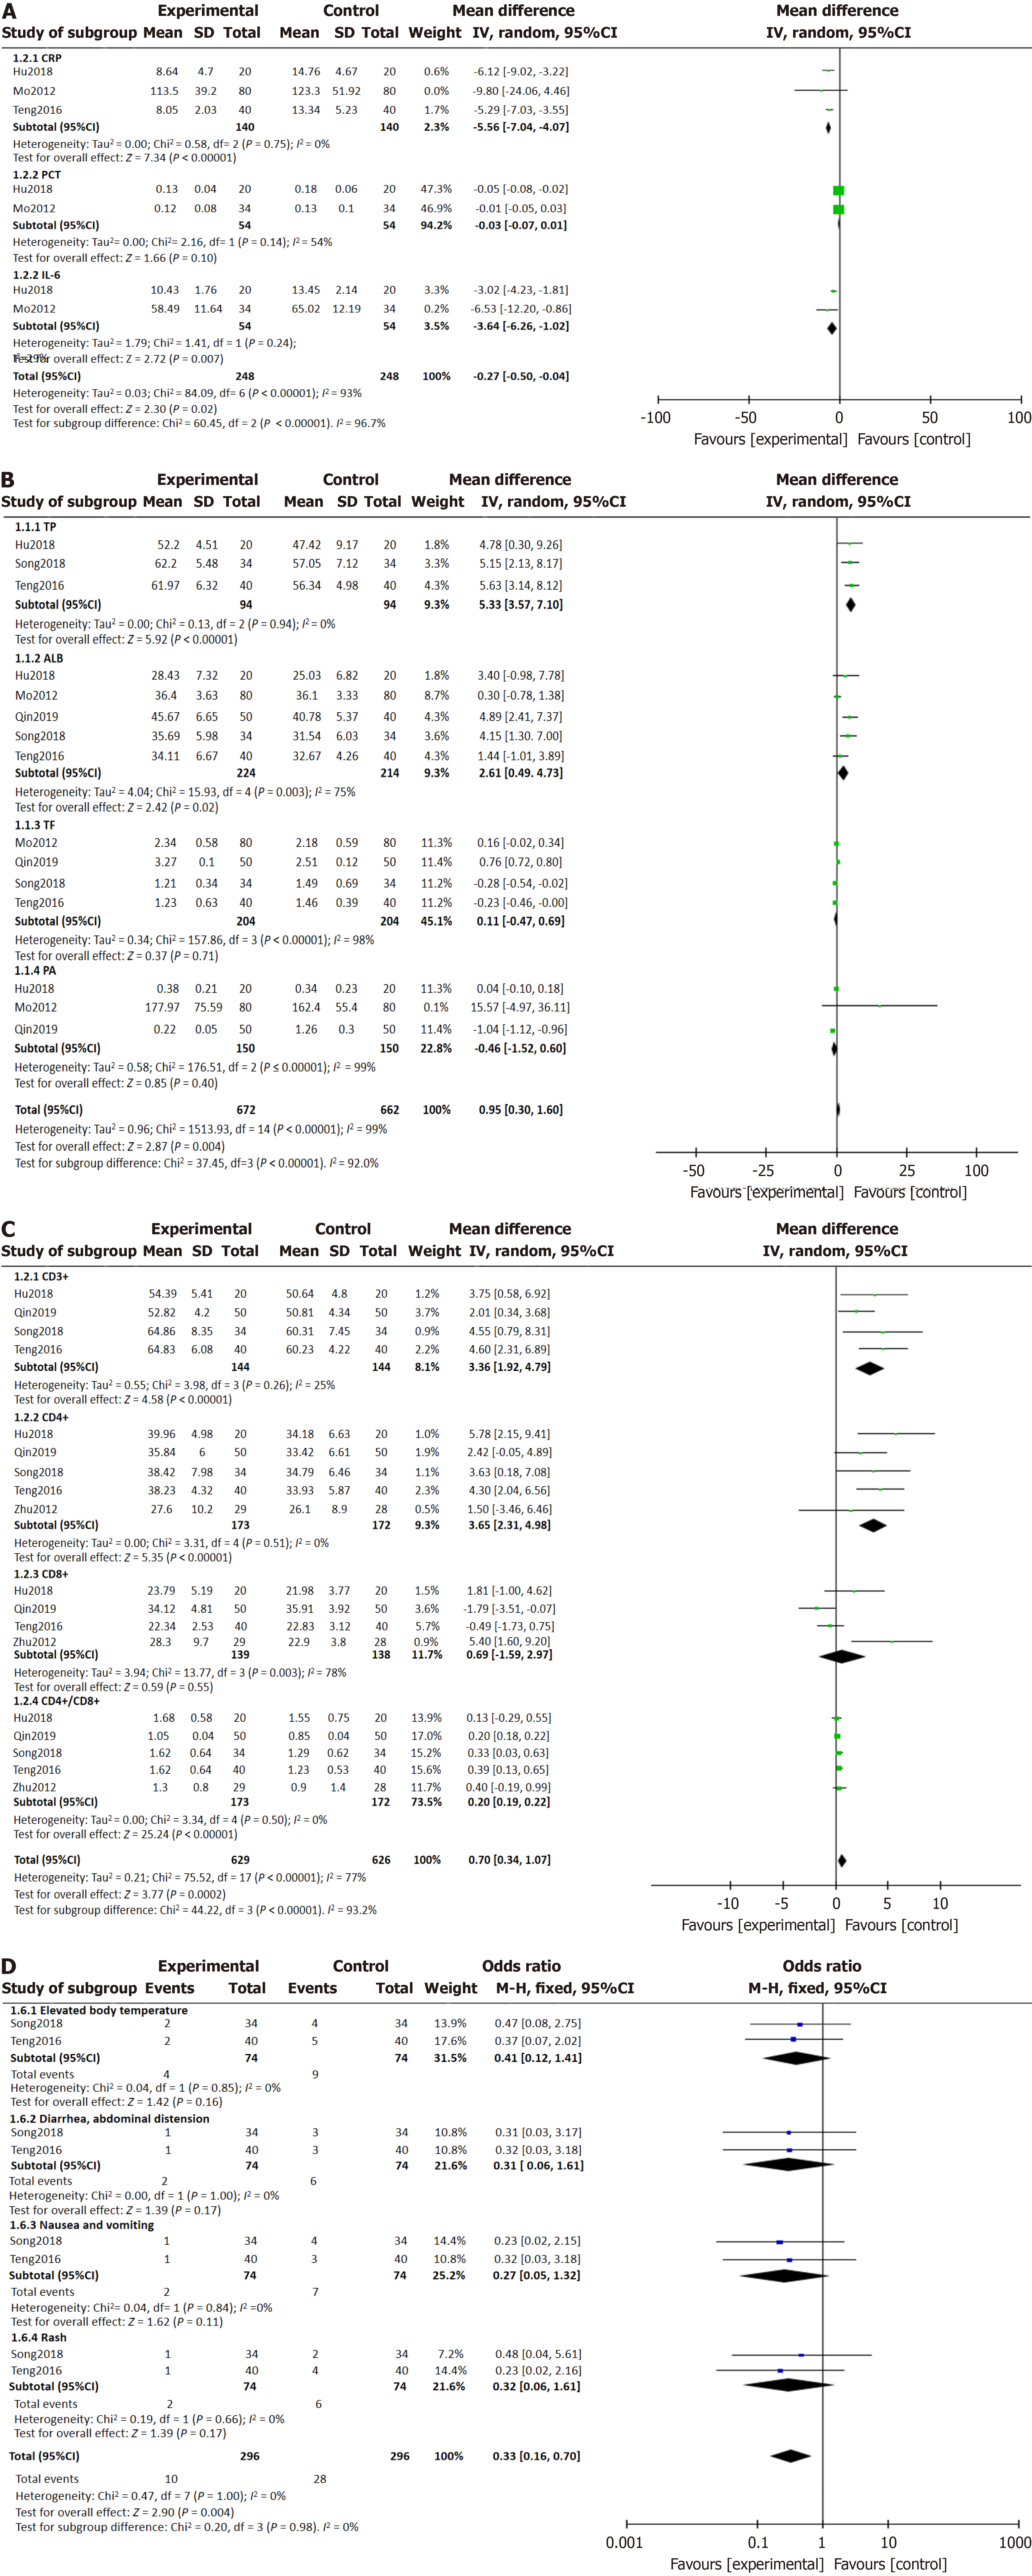
Figure 2 Forest plot.
A: Forest plot for differences in inflammatory factors between experimental group and control group after treatment; B: Forest plot for difference of nutritional status indicators after treatment between experimental group and control group; C: Forest plot for difference of T lymphocyte subsets after treatment between experimental group and control group; D: Forest plot for the incidence of adverse reactions after treatment between experimental group and control group. CI: Confidence interval; CRP: C-reactive protein; PCT: Procalcitonin; IL: Interleukin; TP: Total protein; ALB: Albumin; TF: Transferrin; PA: Prealbumin.
- Citation: Gan QH, Li SQ, Gan XL, Jiang ZQ, Jian ZY. Parenteral nutrition with n-3 polyunsaturated fatty acids on nutrition inflammatory and immune status of gastrointestinal cancer patients: Meta-analysis. World J Gastrointest Surg 2025; 17(5): 105743
- URL: https://www.wjgnet.com/1948-9366/full/v17/i5/105743.htm
- DOI: https://dx.doi.org/10.4240/wjgs.v17.i5.105743


