Copyright
©The Author(s) 2025.
World J Gastrointest Surg. May 27, 2025; 17(5): 102335
Published online May 27, 2025. doi: 10.4240/wjgs.v17.i5.102335
Published online May 27, 2025. doi: 10.4240/wjgs.v17.i5.102335
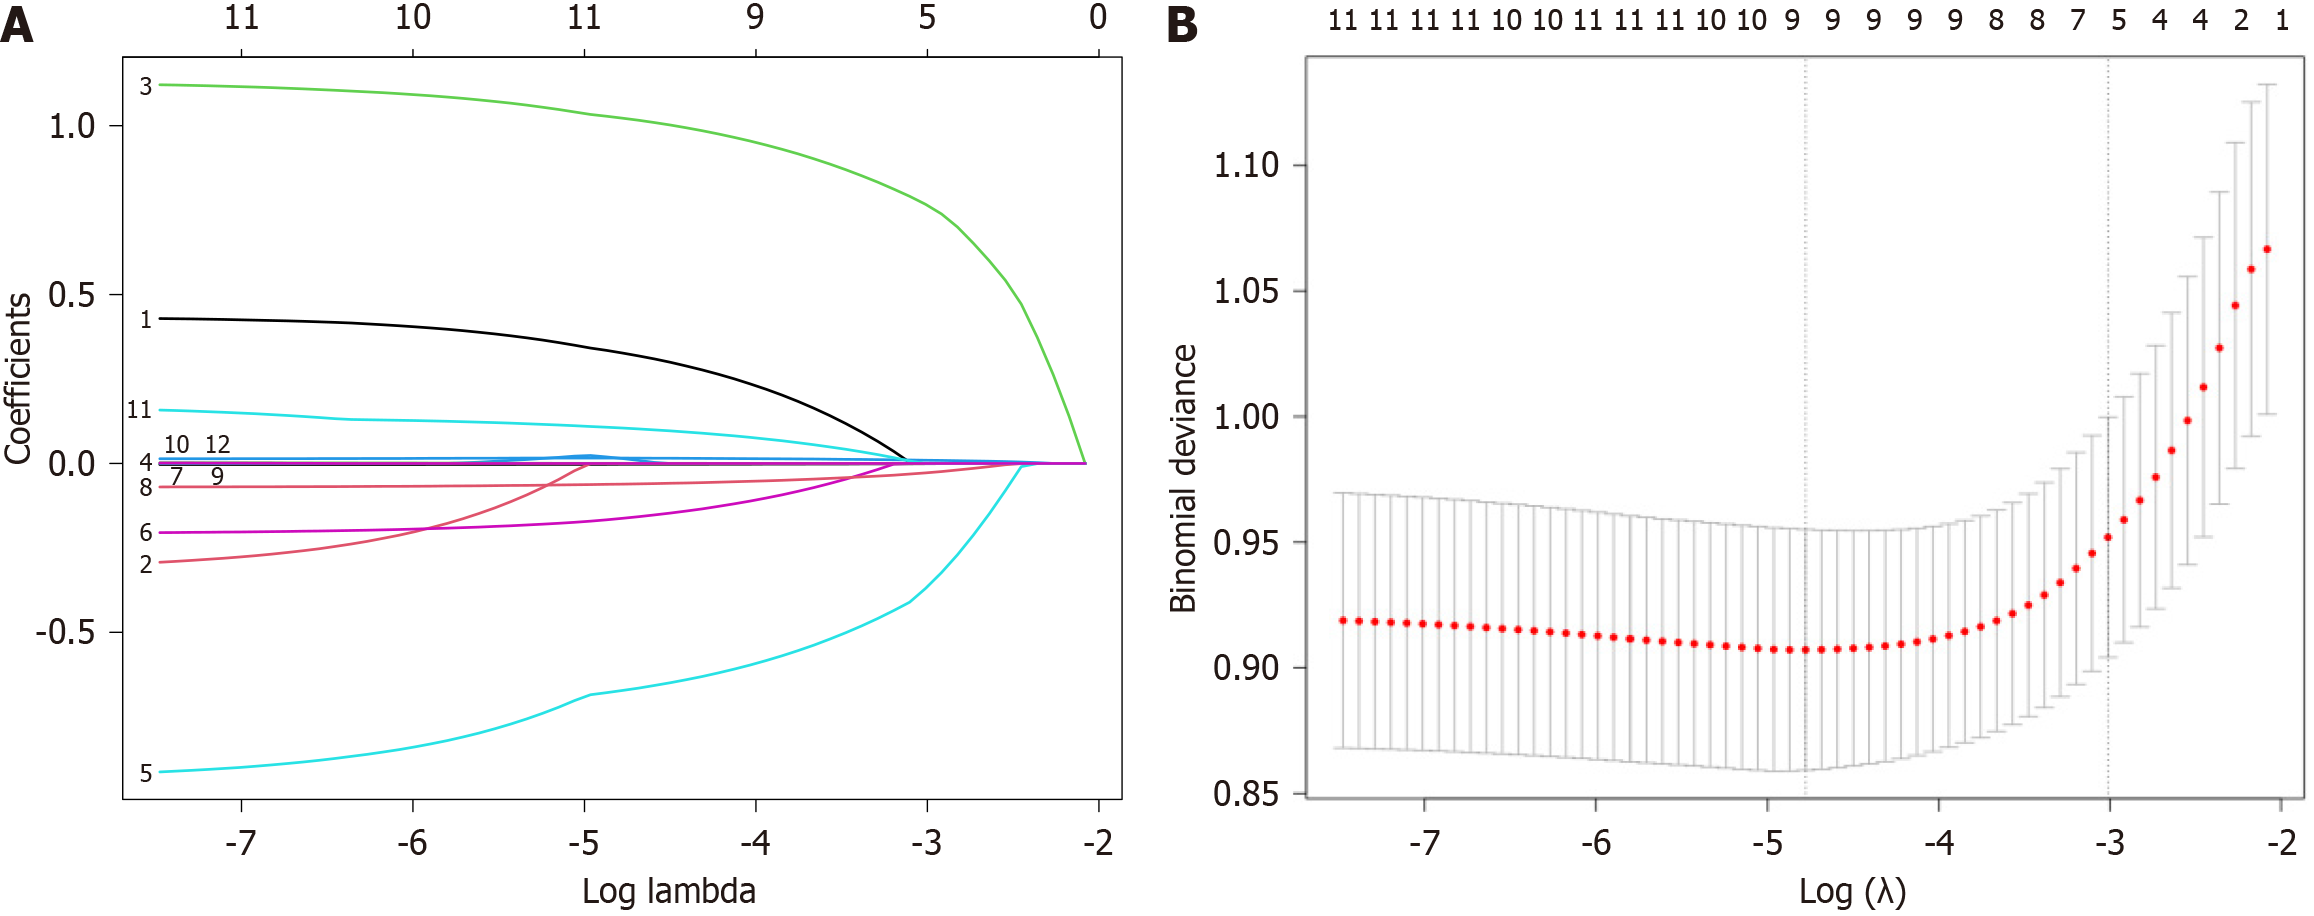
Figure 2 Application of least absolute shrinkage and selection operator regression analysis for predictor variable selection.
A: The least absolute shrinkage and selection operator coefficient trajectory path diagram, where each line represents the coefficient trajectory of an independent variable; B: The cross-validation curve for least absolute shrinkage and selection operator regression analysis, with the dashed line on the left indicating the log (λ) value corresponding to the minimum mean-square error. By selecting log (λ) at the minimum mean-square error, five variables with non-zero coefficients were identified.
- Citation: Tang L, Chen LX, Luo CC, Zhao Y. Predicting risk of post-hepatectomy liver failure in patients undergoing liver resection with controlled low central venous pressure. World J Gastrointest Surg 2025; 17(5): 102335
- URL: https://www.wjgnet.com/1948-9366/full/v17/i5/102335.htm
- DOI: https://dx.doi.org/10.4240/wjgs.v17.i5.102335


