Copyright
©The Author(s) 2025.
World J Gastrointest Surg. May 27, 2025; 17(5): 102201
Published online May 27, 2025. doi: 10.4240/wjgs.v17.i5.102201
Published online May 27, 2025. doi: 10.4240/wjgs.v17.i5.102201
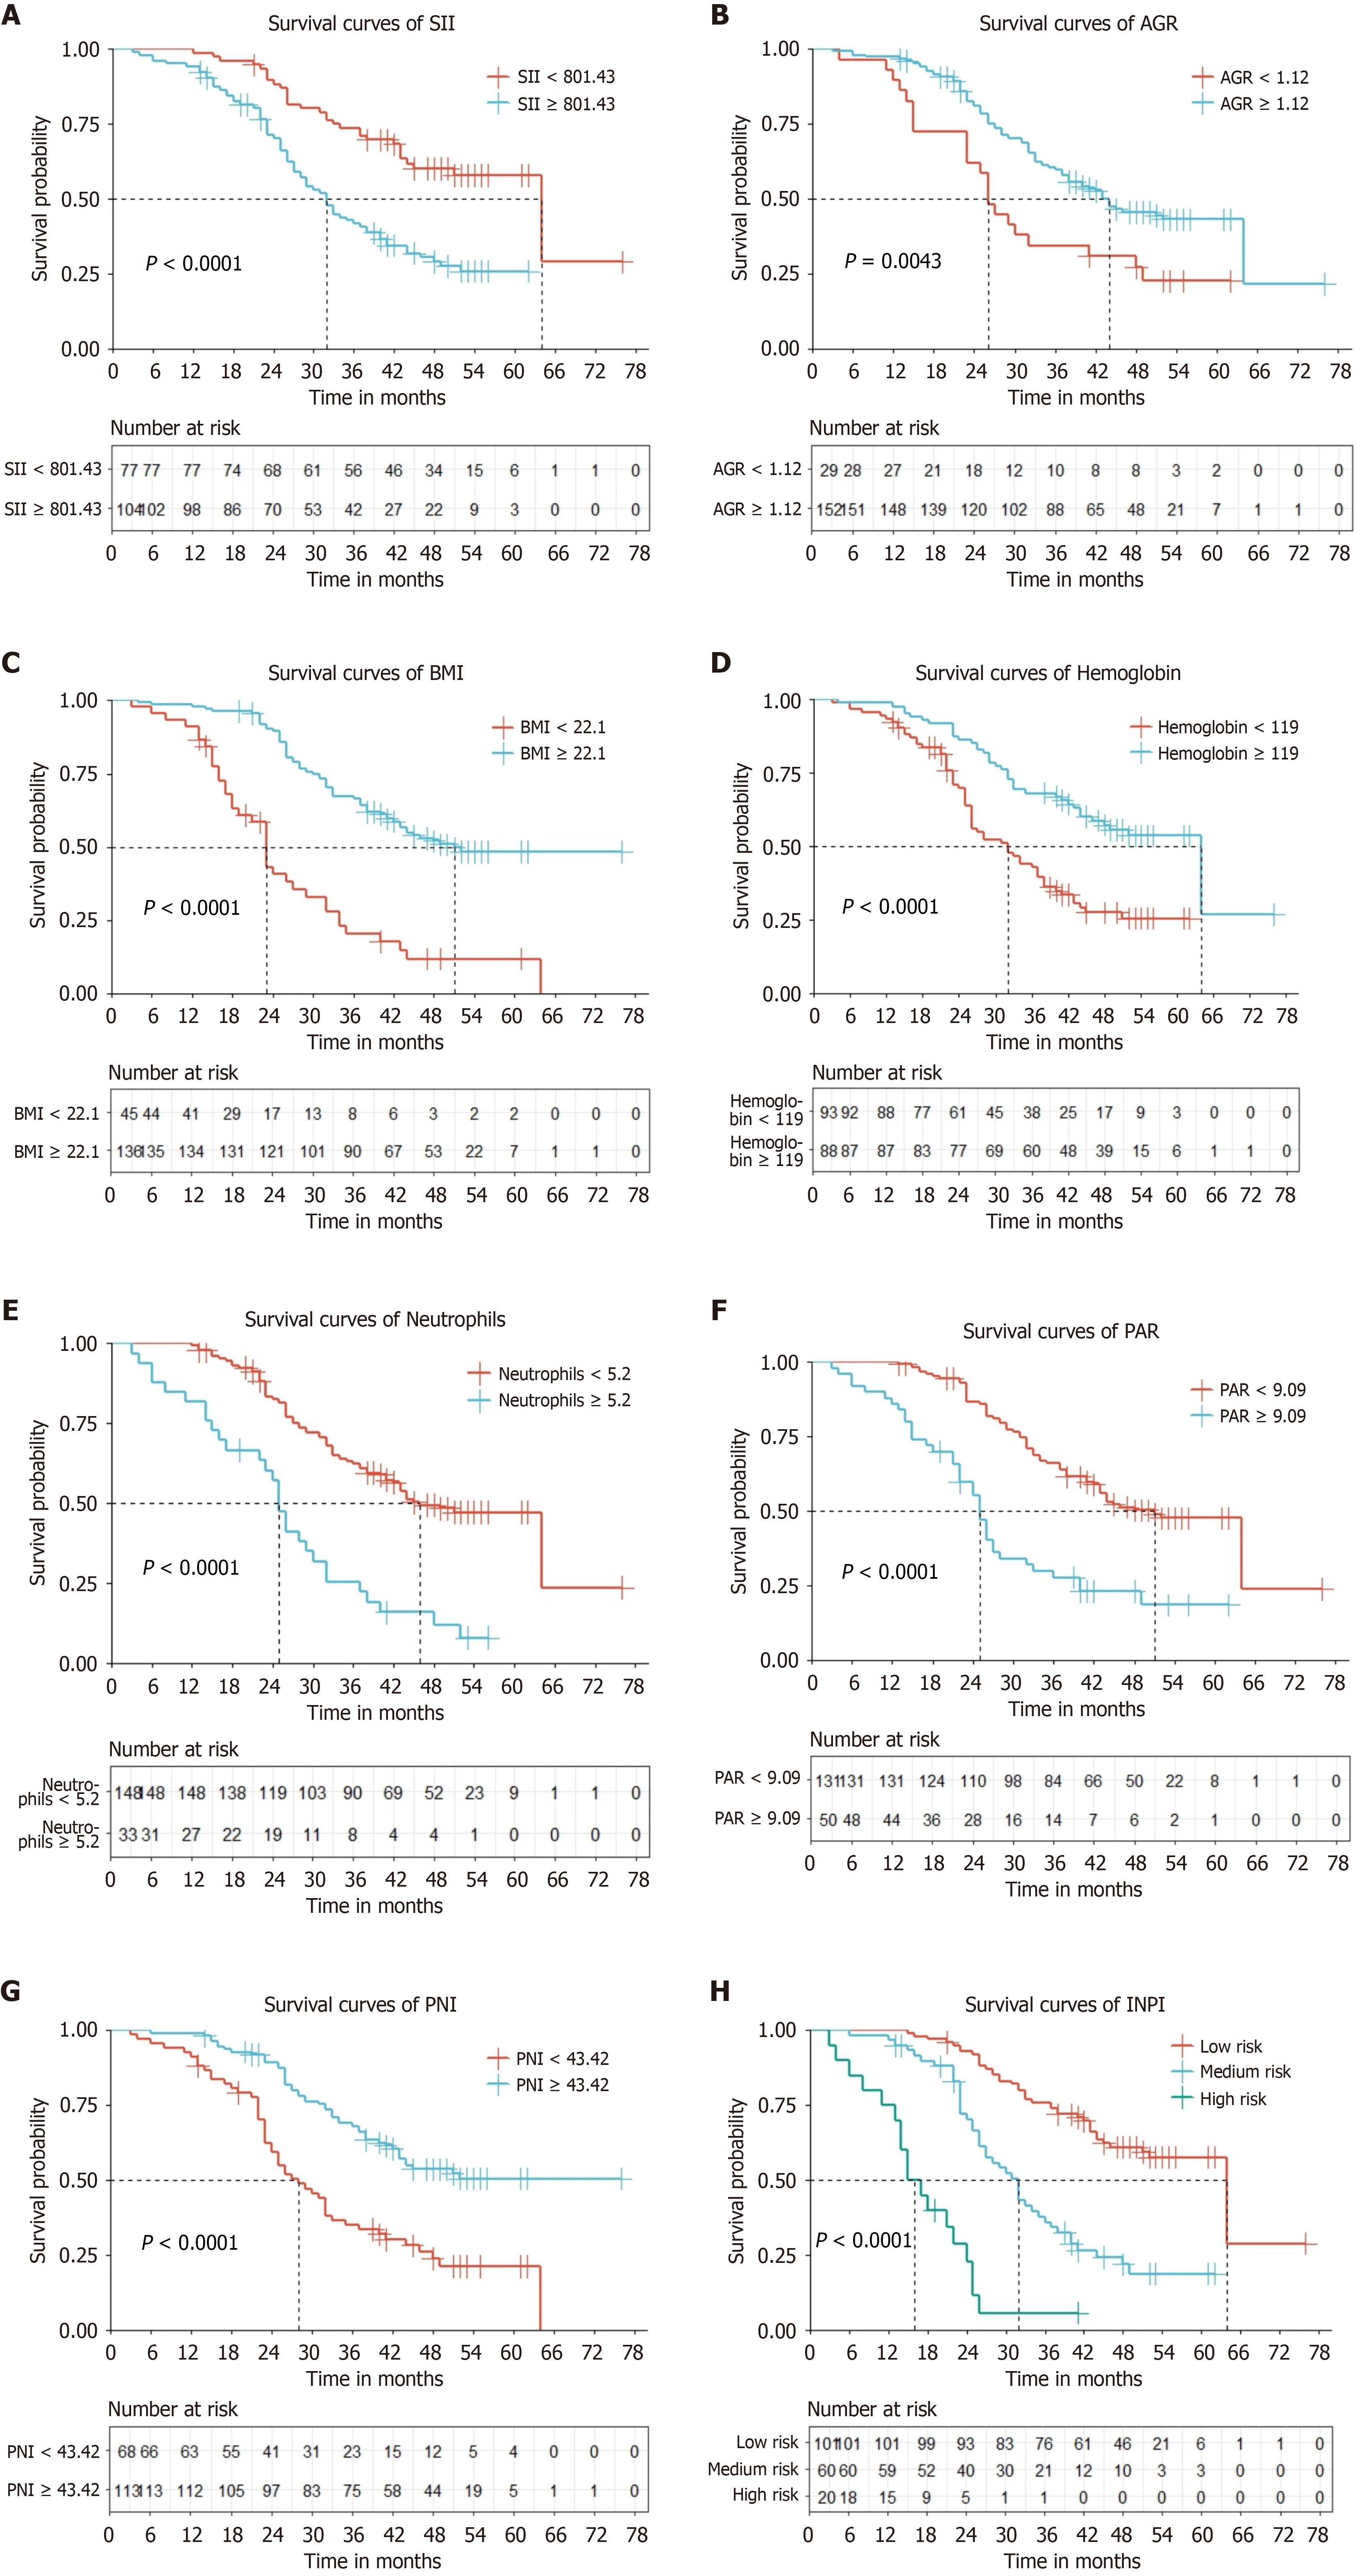
Figure 3 Survival curves via Kaplan-Meier analysis of 7 inflammation and nutrition indicators and inflammatory-nutritional prognostic index groups.
A: Survival curves of systemic immune-inflammatory index (≥ 801.43 vs < 801.43); B: Survival curves of albumin-to-globulin ratio (AGR) (≥ 1.12 vs < 1.12); C: Survival curves of body mass index (≥ 22.1 vs < 22.1); D: Survival curves of AGR hemoglobin (≥ 119 vs < 119); E: Survival curves of neutrophils (≥ 5.2 vs < 5.2); F: Survival curves of platelet-to-albumin ratio (≥ 9.09 vs < 9.09); G: Survival curves of prognostic nutritional index (≥ 43.42 vs < 43.42); H: Survival curves of inflammatory-nutritional prognostic index (low risk vs medium risk vs high risk). SII: Systemic immune-inflammatory index; AGR: Albumin-to-globulin ratio; PAR: Platelet-to-albumin ratio; INPI: Inflammatory nutritional prognostic index.
- Citation: Wang L, Chen MZ, Liu L, Jiang ZN, Zhang SM, Zhang MS, Zhang XX, Liu RQ, Wang DS. Novel inflammatory-nutritional prognostic index for advanced gastric cancer patients undergoing gastrectomy and prophylactic hyperthermic intraperitoneal chemotherapy. World J Gastrointest Surg 2025; 17(5): 102201
- URL: https://www.wjgnet.com/1948-9366/full/v17/i5/102201.htm
- DOI: https://dx.doi.org/10.4240/wjgs.v17.i5.102201


