
















©The Author(s) 2025.
World J Gastrointest Surg. Dec 27, 2025; 17(12): 110617
Published online Dec 27, 2025. doi: 10.4240/wjgs.v17.i12.110617
Published online Dec 27, 2025. doi: 10.4240/wjgs.v17.i12.110617
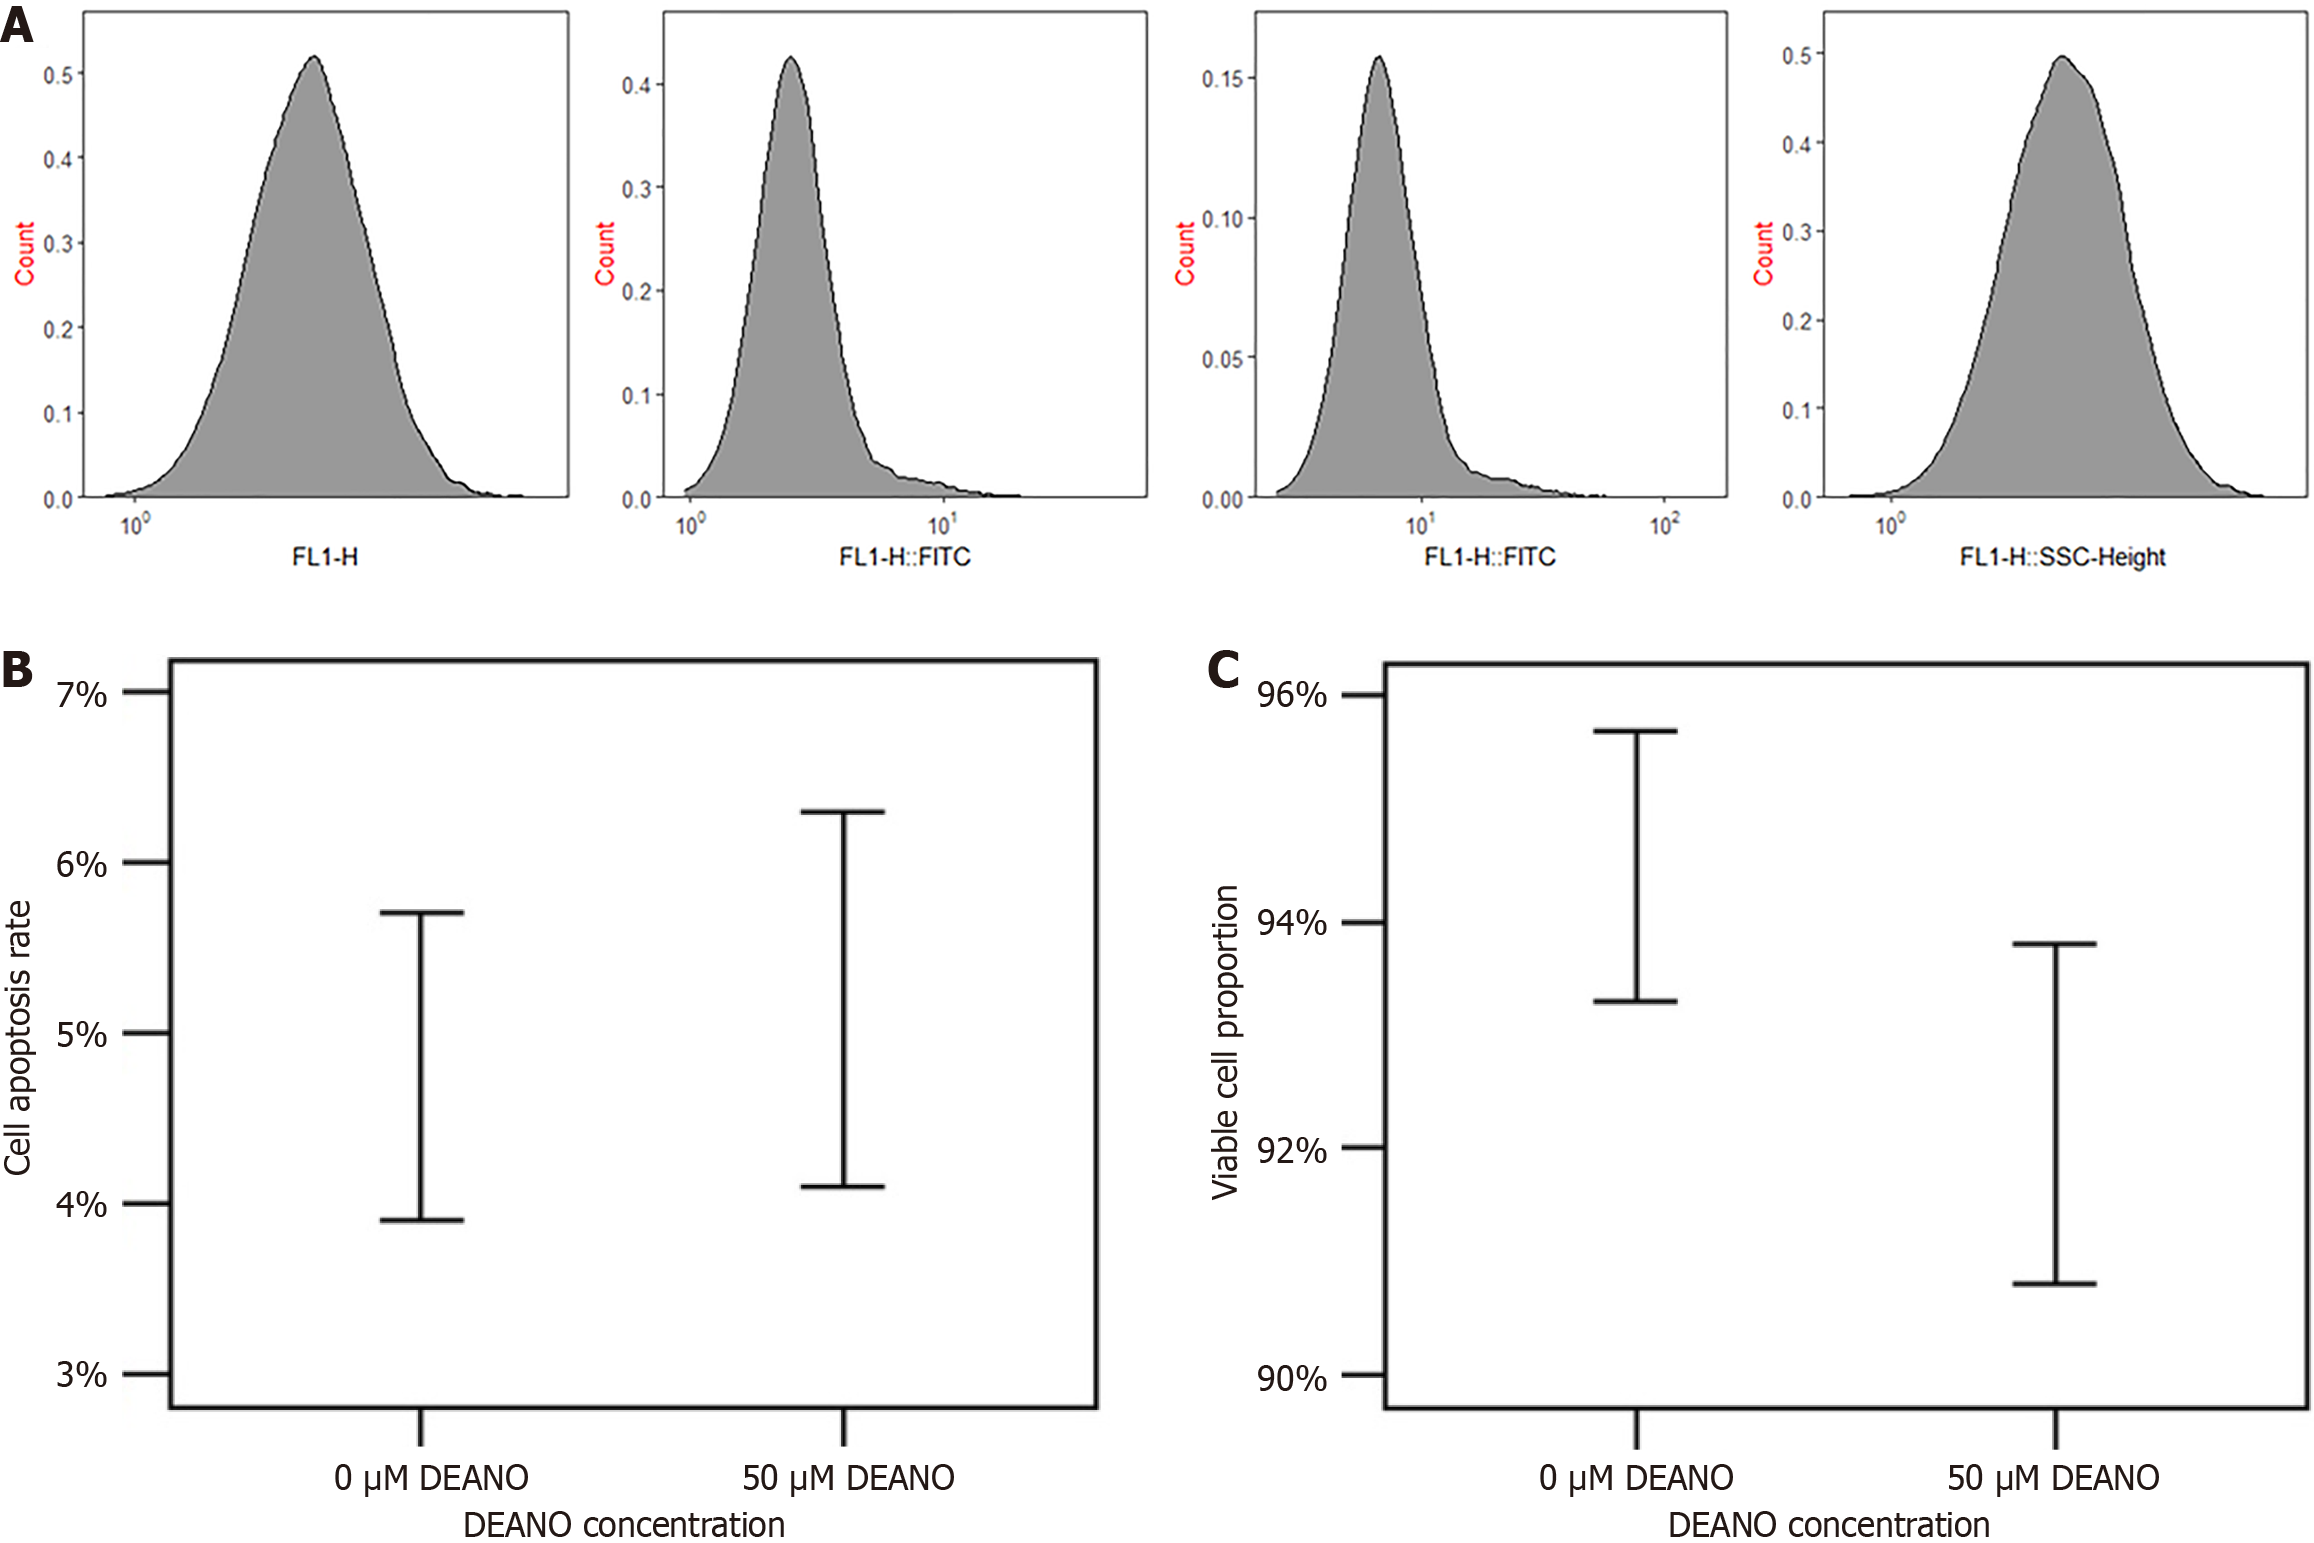
Figure 5 Flow cytometry analysis of DAF-FM probe cytotoxicity.
A: Flow cytometry dot plots (FL1-H: FITC, SSC-H: Side scatter) of esophageal cancer cells treated with 0 μM, 50 μM, 150 μM, 300 μM DEANO; B: Bar chart of apoptotic rate (0 μM DEANO: 4.8% ± 0.9%, 50 μM DEANO: 5.2% ± 1.1%, P > 0.05); C: Bar chart of the proportion of living cells (0 μM DEANO: 94.5% ± 1.2%, 50 μM DEANO: 92.3% ± 1.5%, P > 0.05). Data are expressed as mean ± SD, n = 3 per group.
- Citation: Chen WH, Cai CF, Gao BZ, Hong WS, Xu YZ, Cai WJ. Visual screening and efficacy evaluation of high-performance fluorescent probe DAF-FM in esophagitis cancer transformation. World J Gastrointest Surg 2025; 17(12): 110617
- URL: https://www.wjgnet.com/1948-9366/full/v17/i12/110617.htm
- DOI: https://dx.doi.org/10.4240/wjgs.v17.i12.110617