
















©The Author(s) 2025.
World J Gastrointest Surg. Dec 27, 2025; 17(12): 110617
Published online Dec 27, 2025. doi: 10.4240/wjgs.v17.i12.110617
Published online Dec 27, 2025. doi: 10.4240/wjgs.v17.i12.110617
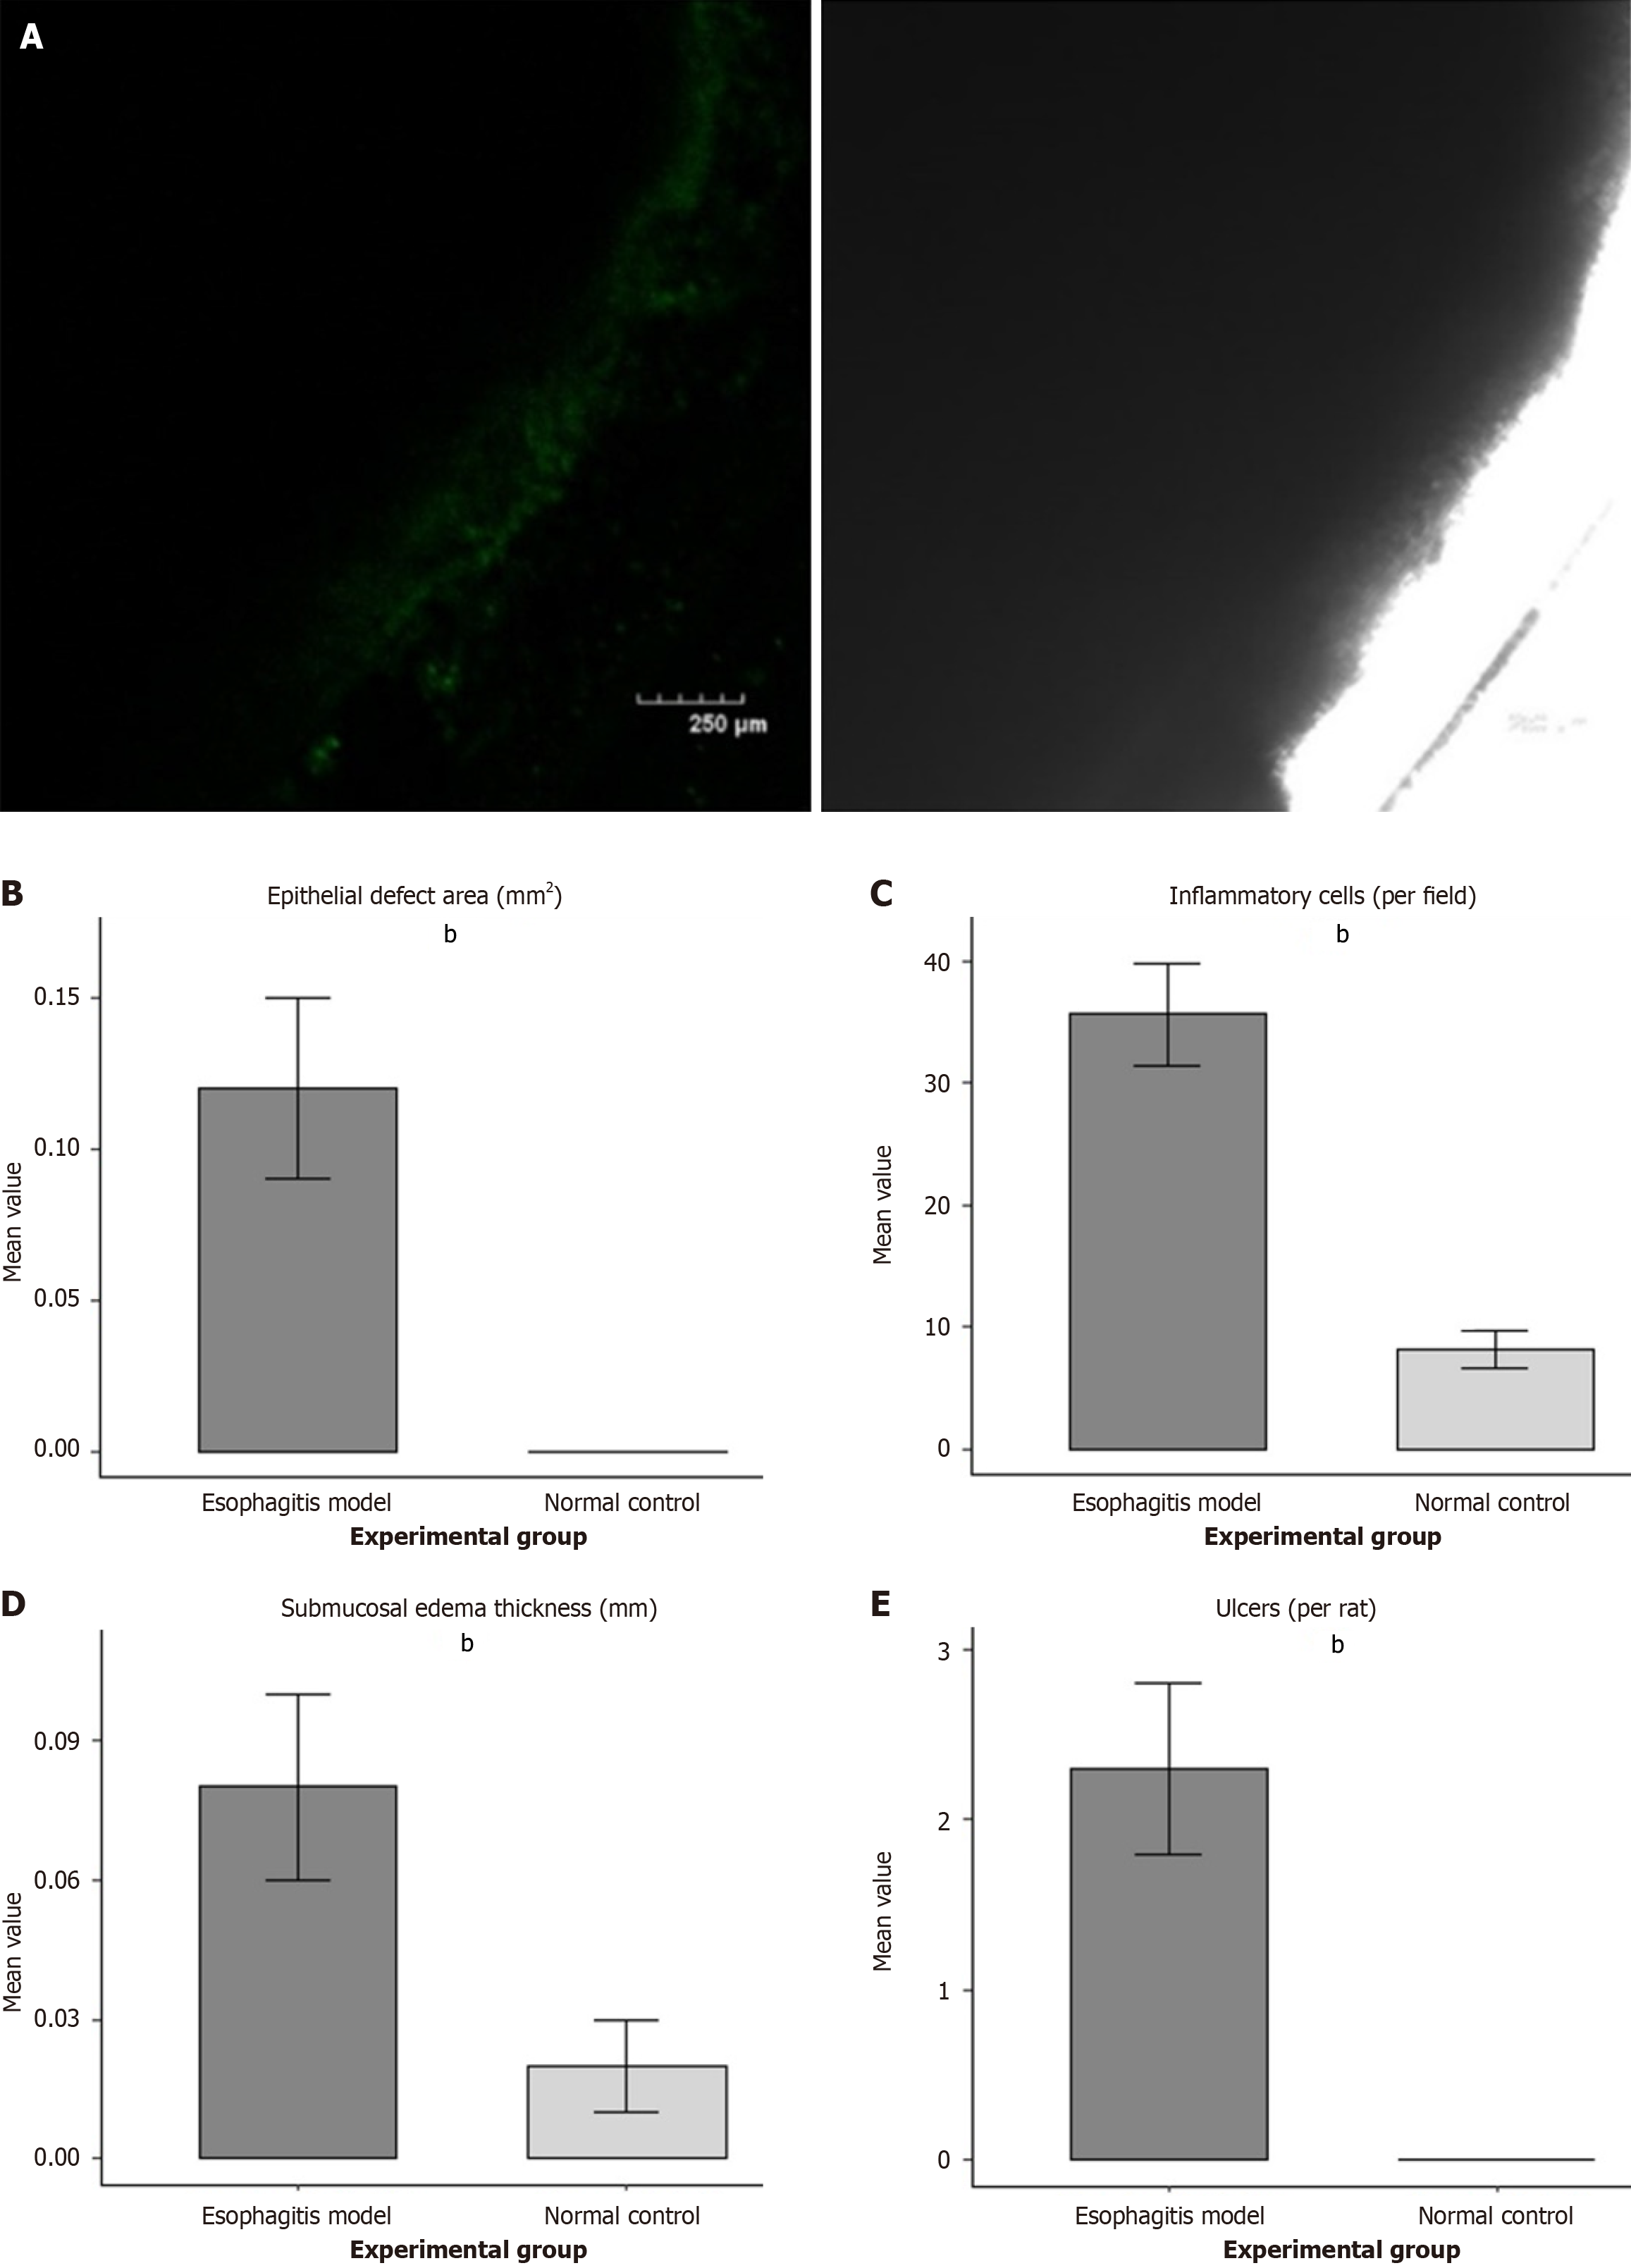
Figure 1 Imaging of a rat model of esophagitis.
A: Hematoxylin-eosin staining of esophageal tissue in the normal control group (left) and esophagitis model group (right); B: Quantitative statistical chart of inflammatory cell count per field of view (normal group: 8.2 ± 1.5, esophagitis group: 35.6 ± 4.2); C: Quantitative statistical chart of epithelial defect area (normal group: 0 mm², esophagitis group: 0.12 ± 0.03 mm²); D: Quantitative statistical chart of submucosal edema thickness (normal group: 0.02 ± 0.01 mm, esophagitis group: 0.08 ± 0.02 mm); E: Quantitative statistical chart of ulcer number per rat (normal group: 0, esophagitis group: 2.3 ± 0.5). Scale bar: 250 μm; data are expressed as mean ± SD, n = 10 per group, bP < 0.01.
- Citation: Chen WH, Cai CF, Gao BZ, Hong WS, Xu YZ, Cai WJ. Visual screening and efficacy evaluation of high-performance fluorescent probe DAF-FM in esophagitis cancer transformation. World J Gastrointest Surg 2025; 17(12): 110617
- URL: https://www.wjgnet.com/1948-9366/full/v17/i12/110617.htm
- DOI: https://dx.doi.org/10.4240/wjgs.v17.i12.110617