
















©The Author(s) 2025.
World J Gastrointest Surg. Nov 27, 2025; 17(11): 109991
Published online Nov 27, 2025. doi: 10.4240/wjgs.v17.i11.109991
Published online Nov 27, 2025. doi: 10.4240/wjgs.v17.i11.109991
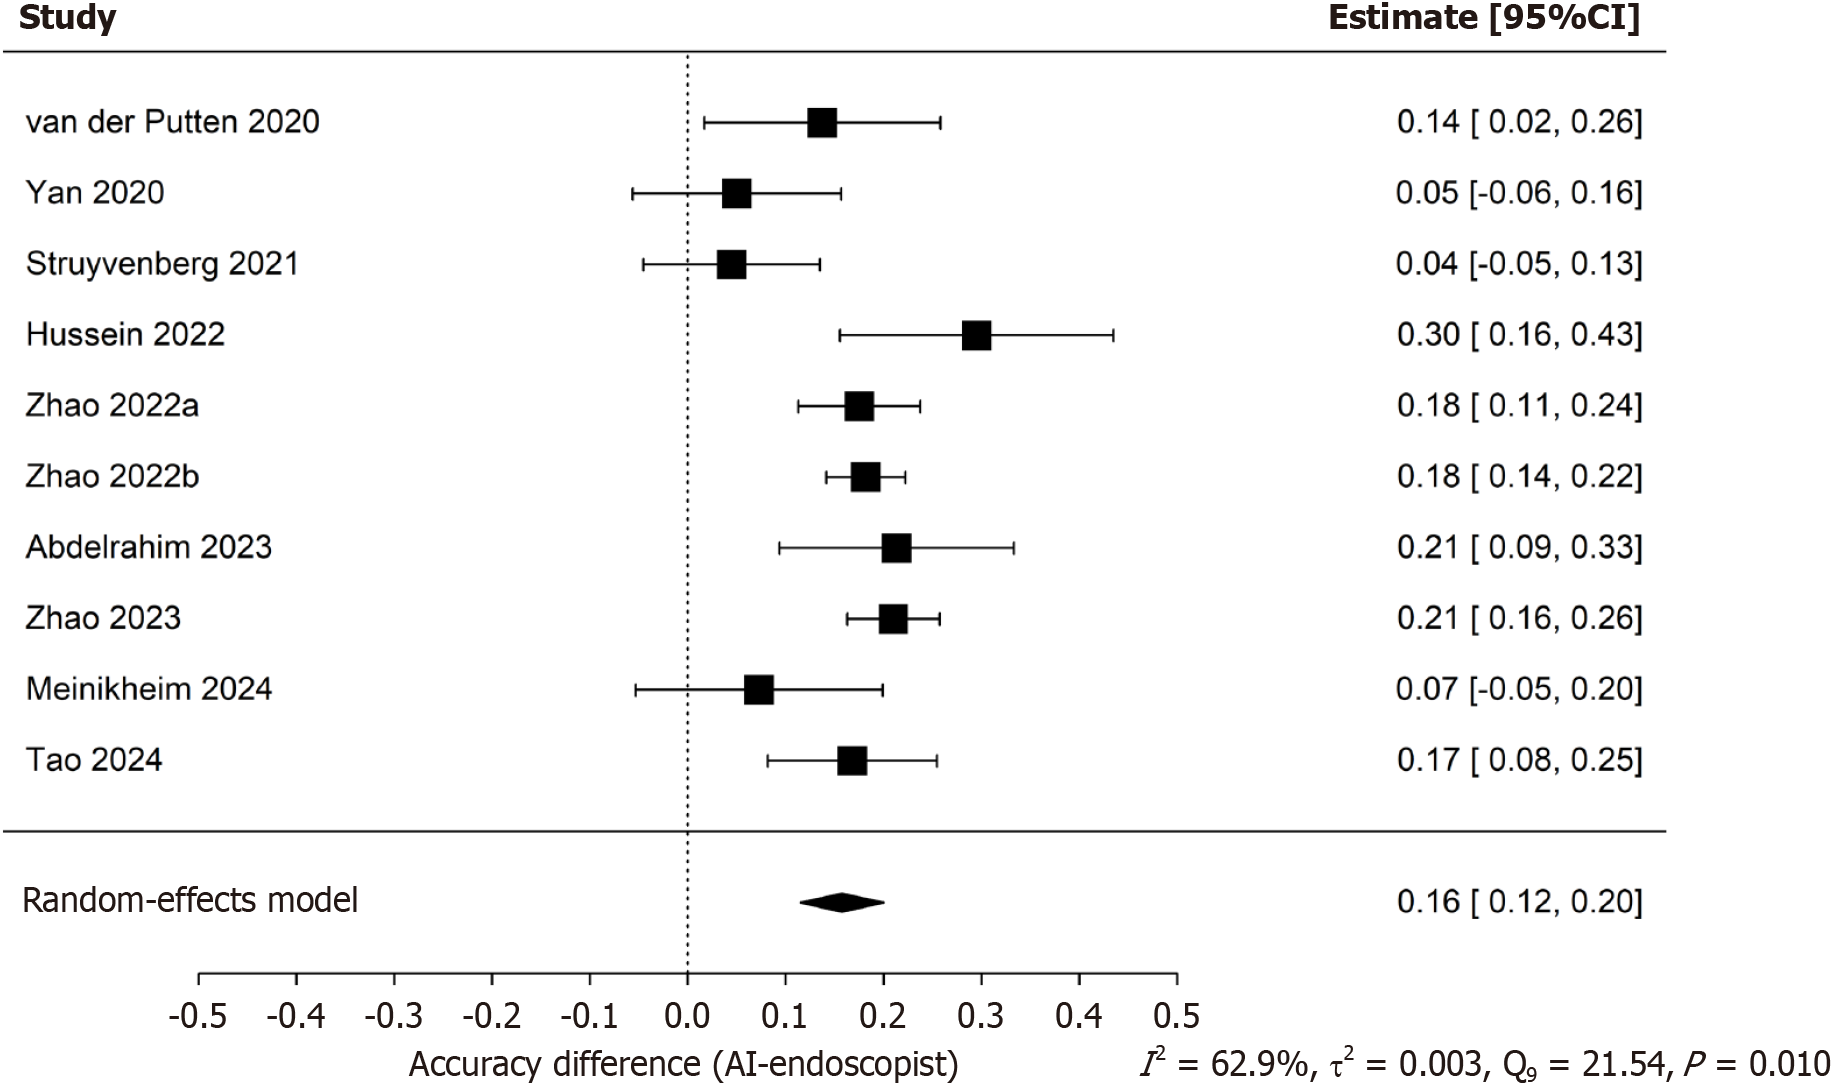
Figure 6 Forest plots of pooled accuracy difference between artificial intelligence-enhanced real-time computer-aided detection systems and conventional endoscopists across all included studies.
Each horizontal line represents the 95% confidence interval (CI) for the accuracy difference in an individual study. A positive value indicates that the Artificial intelligence-enhanced real-time computer-aided detection systems system had higher diagnostic accuracy than endoscopists. The size of the square reflects the weight of each study in the meta-analysis, and the diamond at the bottom represents the pooled effect estimate with its 95%CI, calculated using a random-effects model. CI: Confidence interval.
- Citation: Li ZY, Liu YH, Cai HQ. Diagnostic value of real-time computer-aided detection for precancerous lesion during esophagogastroduodenoscopy: A meta-analysis. World J Gastrointest Surg 2025; 17(11): 109991
- URL: https://www.wjgnet.com/1948-9366/full/v17/i11/109991.htm
- DOI: https://dx.doi.org/10.4240/wjgs.v17.i11.109991