
















©The Author(s) 2025.
World J Gastrointest Surg. Oct 27, 2025; 17(10): 111673
Published online Oct 27, 2025. doi: 10.4240/wjgs.v17.i10.111673
Published online Oct 27, 2025. doi: 10.4240/wjgs.v17.i10.111673
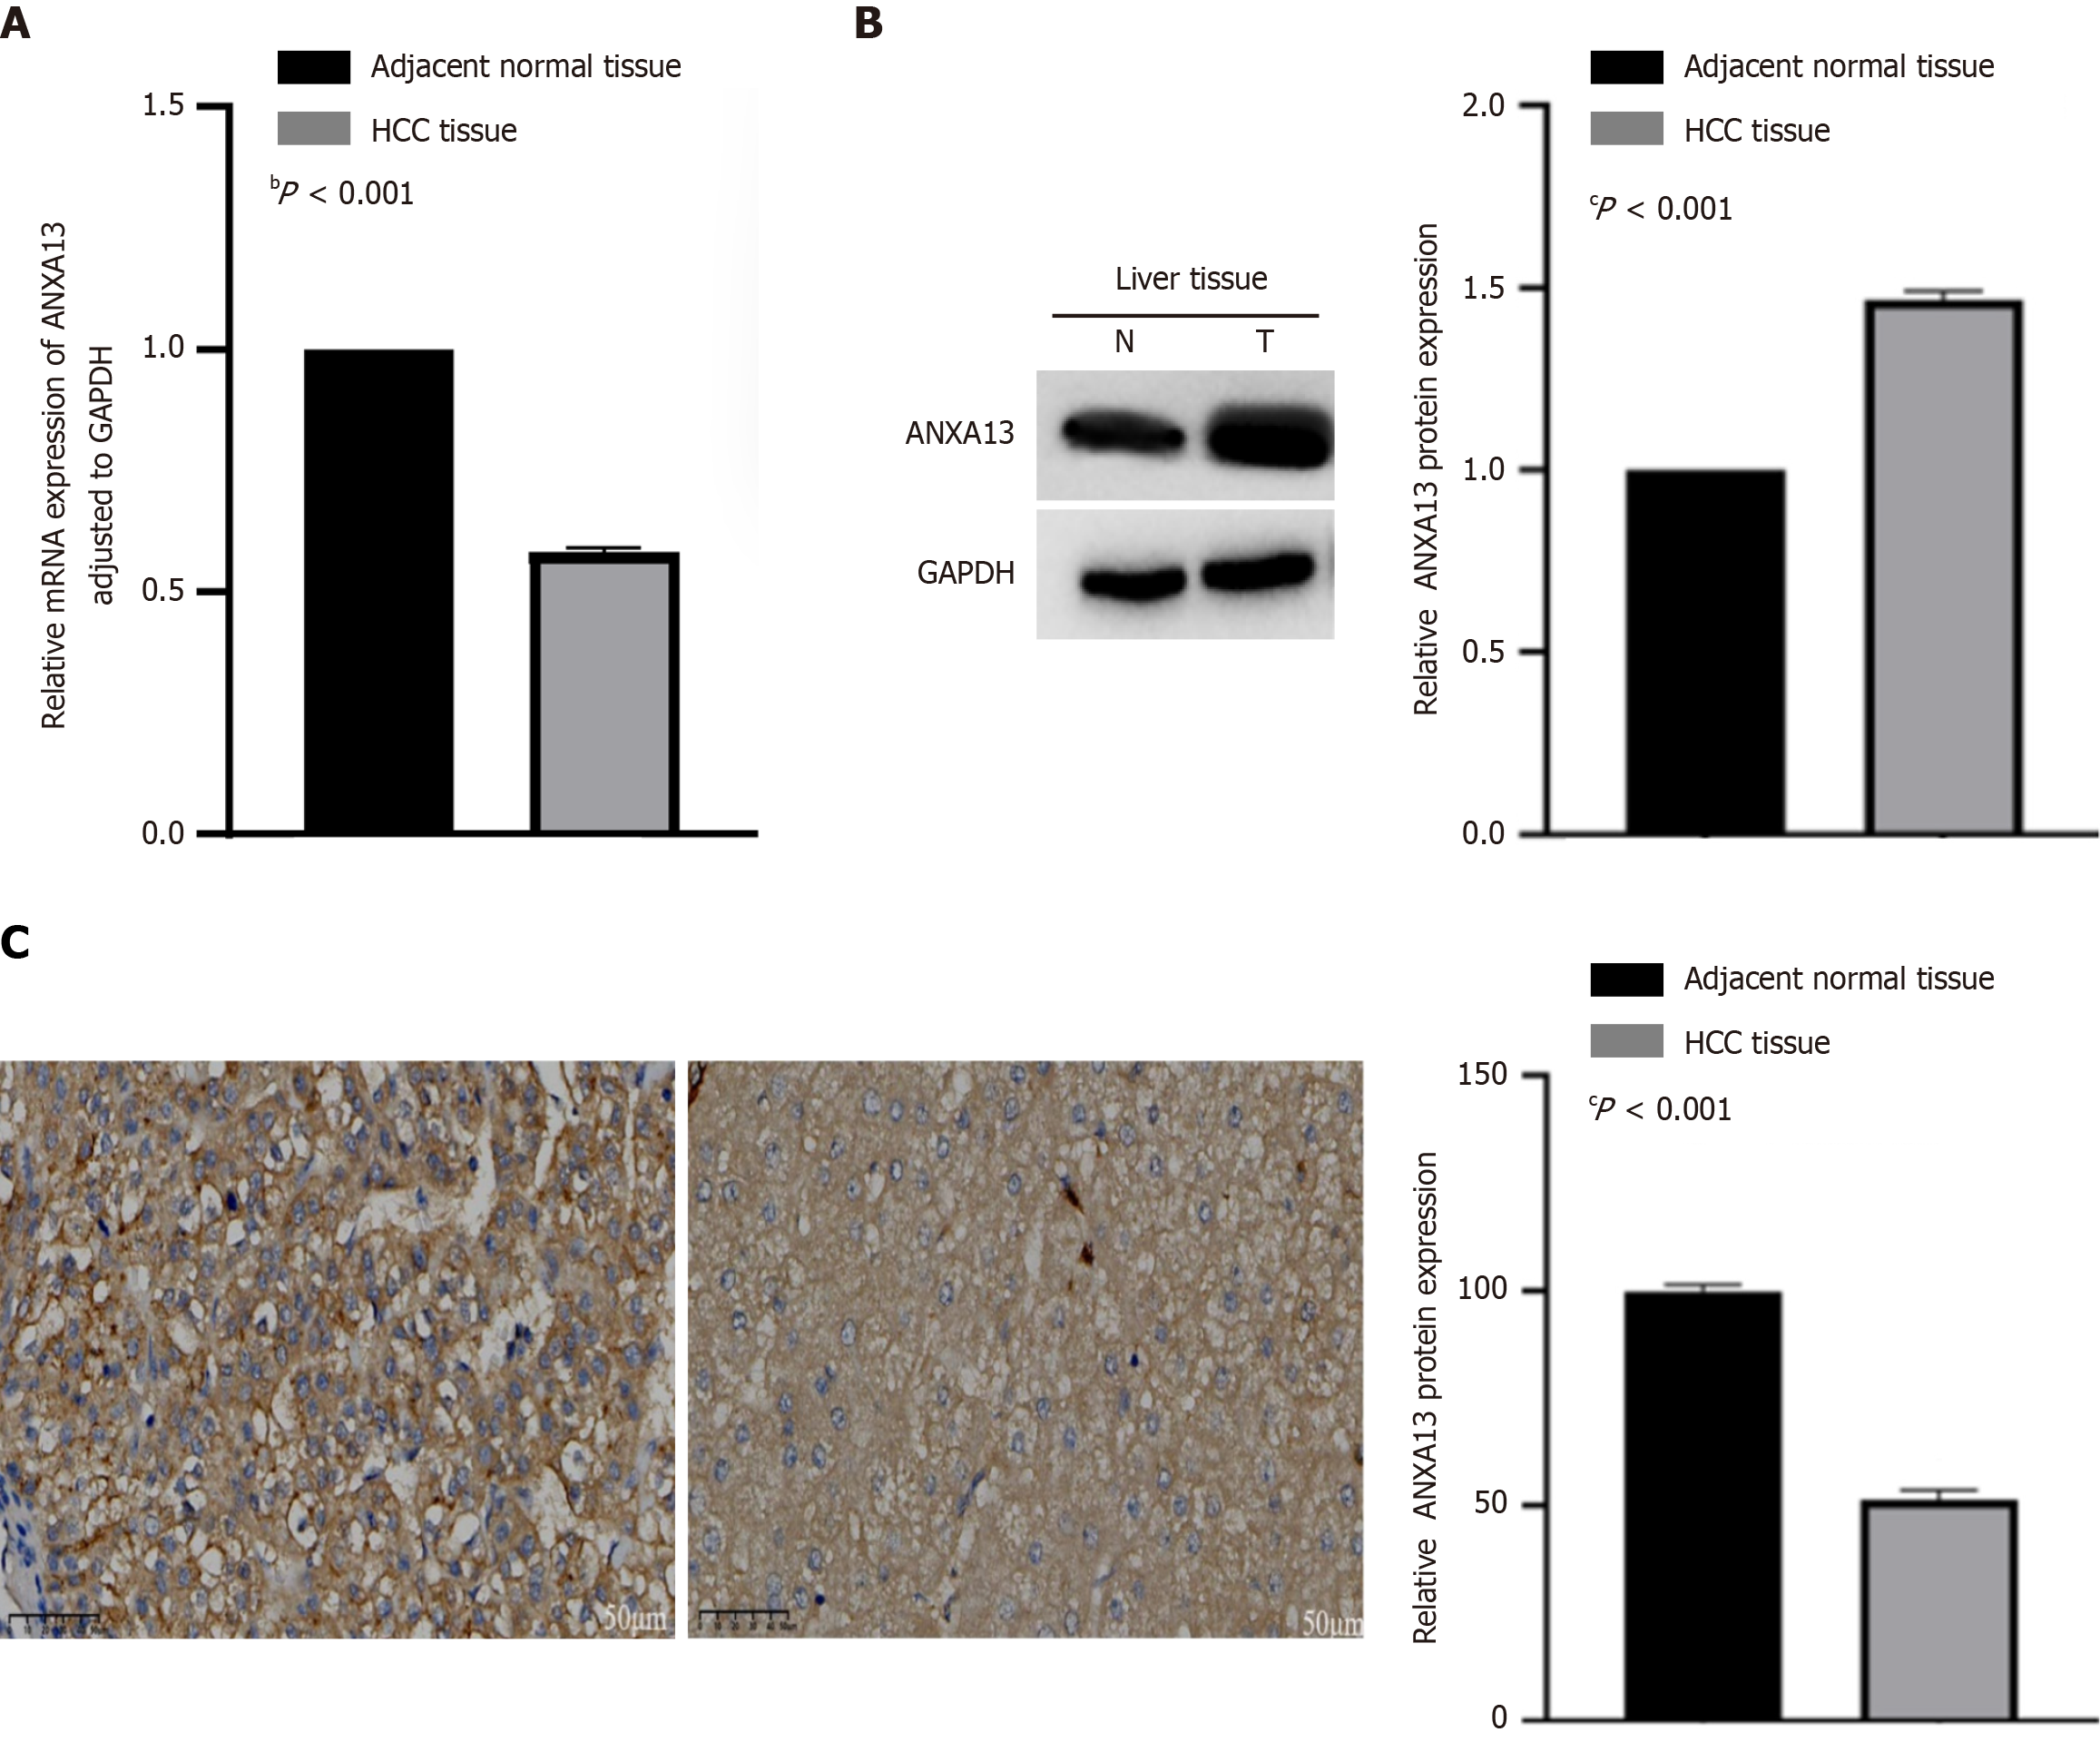
Figure 1 Expression levels of ANXA13 in hepatocellular carcinoma tissues and adjacent non-tumor tissues.
A: Detection of ANXA13 expression in liver cancer tissues and adjacent non-cancerous tissues by quantitative real-time PCR; B: Western blotting shows that the ANXA13 protein is overexpressed in Hepatocellular carcinoma (HCC) tissues. GAPDH was used as a loading control. Use Image J software to analyze protein bands for grayscale analysis, and normalize the grayscale values of the target protein before using GraphPad Prism software for statistical analysis; C: HCC and adjacent non-tumor tissues were subjected to immunohistochemical analysis using Diaminobenzidine staining. Representative images are shown (left panel, Scale bar: 50 μm), and the staining intensity was compared (right panel). Unpaired Student’s t-test was used for data analysis. All data were representative of at least three independent experiments (n = 3; error bar, SD). bP < 0.001; cP < 0.0001. HCC: Hepatocellular carcinoma.
- Citation: Yang SK, Zhao XK, Cui YY, Liu DZ, Zhao ZJ, Zhou L, Wang L, Zhang F. ANXA13 expression patterns in hepatocellular carcinoma and impact on tumor behavior. World J Gastrointest Surg 2025; 17(10): 111673
- URL: https://www.wjgnet.com/1948-9366/full/v17/i10/111673.htm
- DOI: https://dx.doi.org/10.4240/wjgs.v17.i10.111673