
















©The Author(s) 2025.
World J Gastrointest Surg. Oct 27, 2025; 17(10): 110836
Published online Oct 27, 2025. doi: 10.4240/wjgs.v17.i10.110836
Published online Oct 27, 2025. doi: 10.4240/wjgs.v17.i10.110836
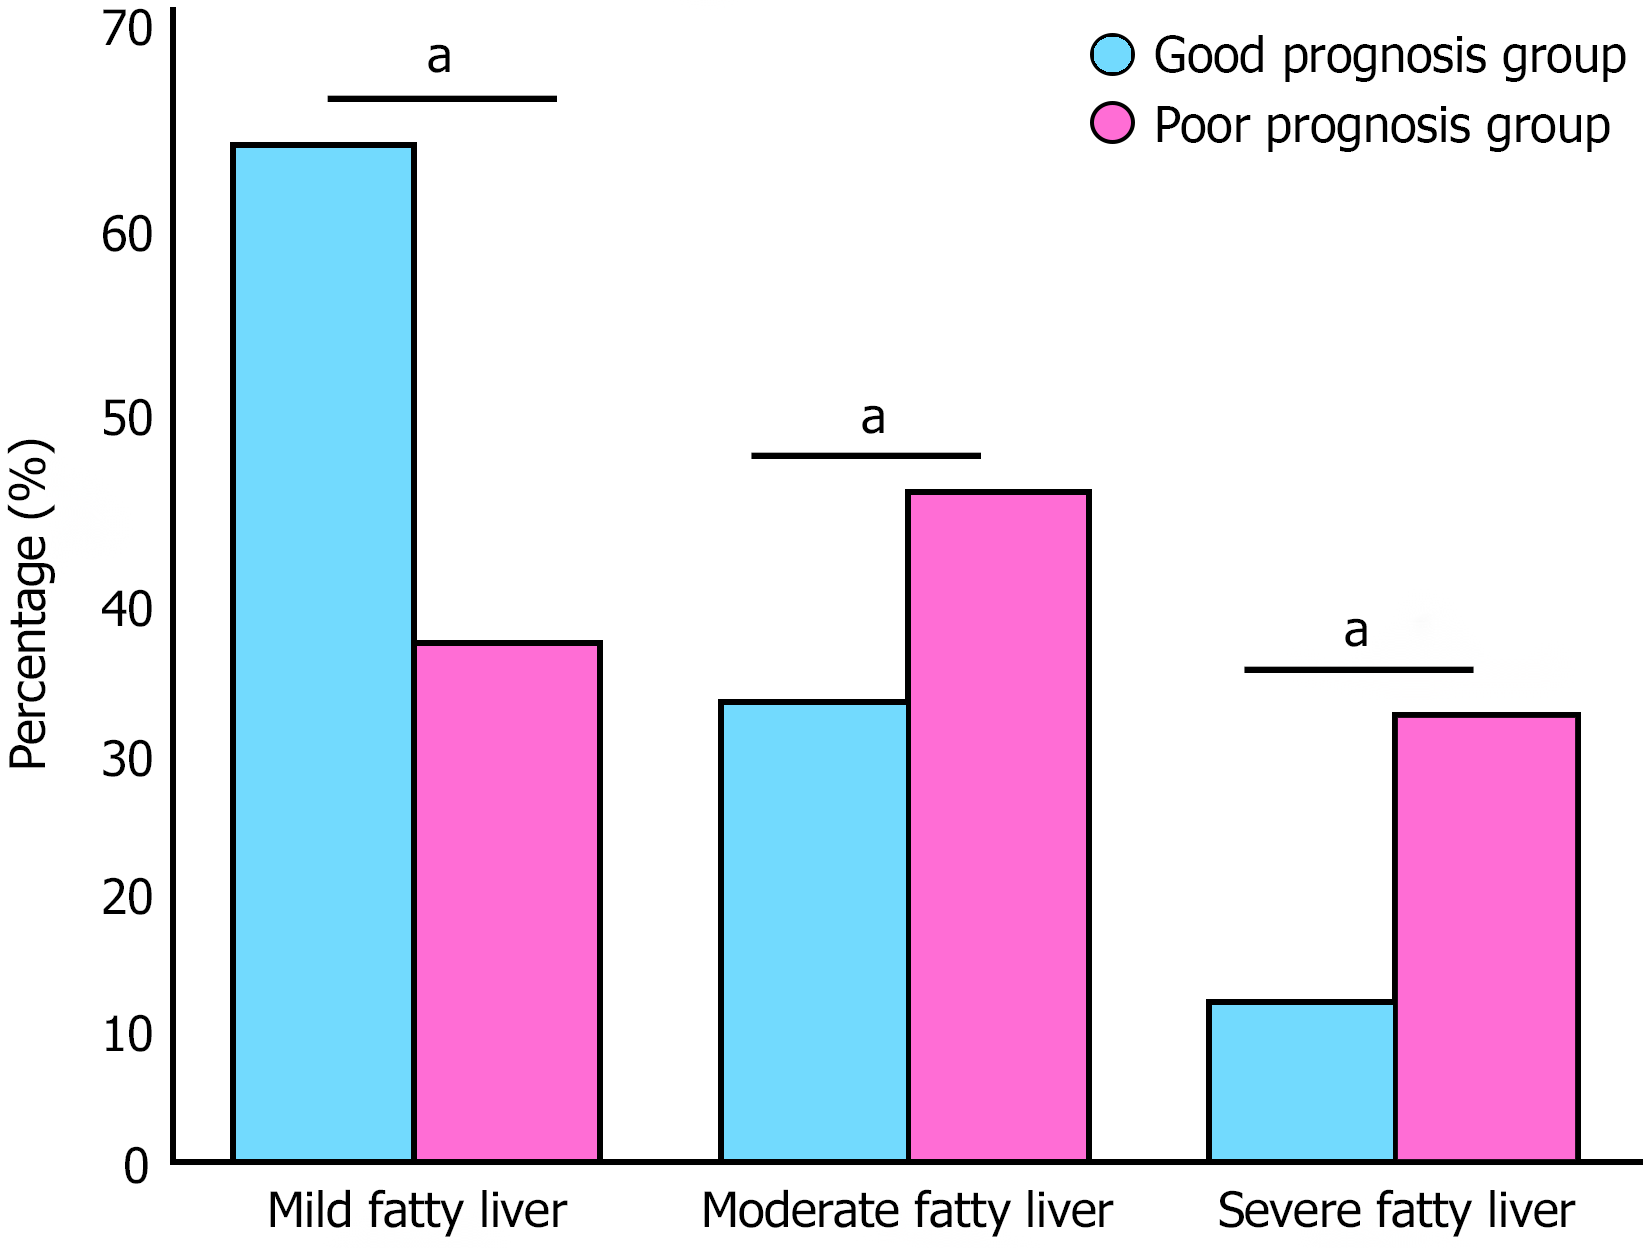
Figure 1 Distribution of fatty liver severity between good and poor prognosis groups.
Distribution of fatty liver severity among 165 patients based on liver-spleen density difference on non-contrast computed tomography imaging. Mild fatty liver was most common (54.6%), followed by moderate (30.9%) and severe (14.5%) fatty liver. Moderate to severe fatty liver was significantly more prevalent in the poor prognosis group compared to the good prognosis group. aP < 0.05.
- Citation: Zhang L, Yang WF, Wu HD, Zhu HH. Risk factors analysis for poor prognosis after percutaneous drainage in liver abscess patients with fatty liver. World J Gastrointest Surg 2025; 17(10): 110836
- URL: https://www.wjgnet.com/1948-9366/full/v17/i10/110836.htm
- DOI: https://dx.doi.org/10.4240/wjgs.v17.i10.110836