
















©The Author(s) 2025.
World J Gastrointest Surg. Oct 27, 2025; 17(10): 109700
Published online Oct 27, 2025. doi: 10.4240/wjgs.v17.i10.109700
Published online Oct 27, 2025. doi: 10.4240/wjgs.v17.i10.109700
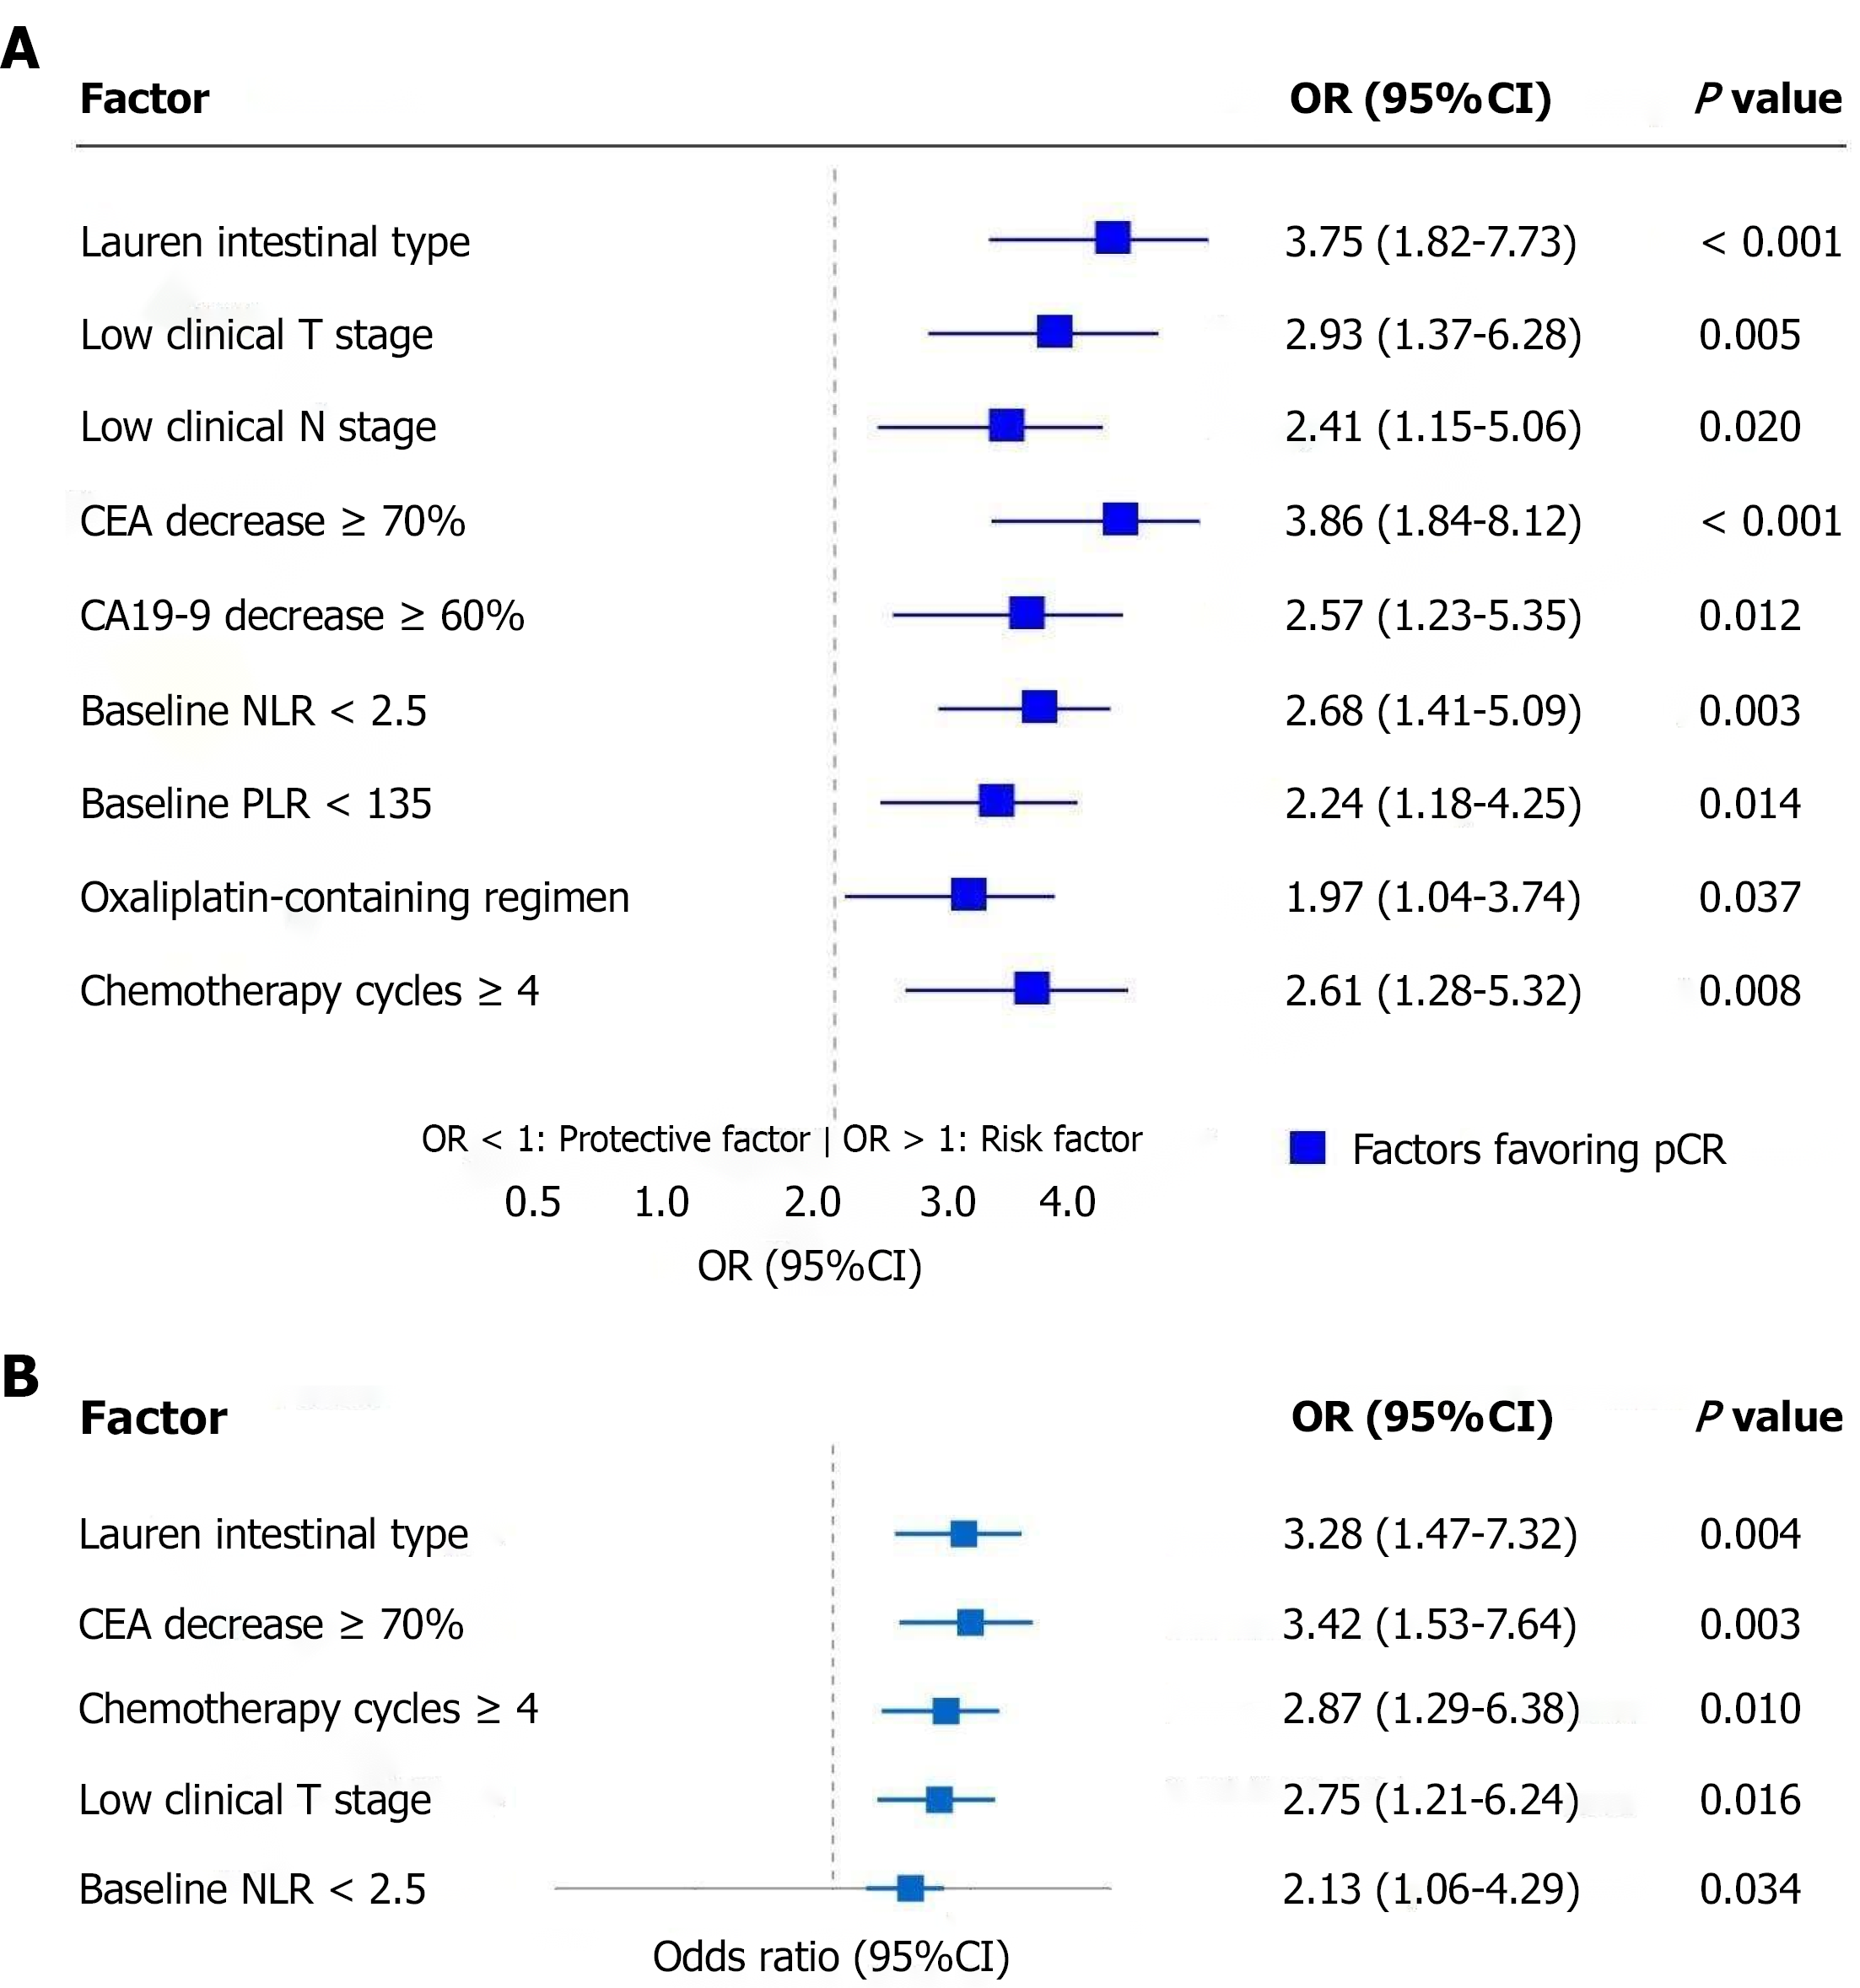
Figure 3 Forest plots.
A: Univariate analysis of factors associated with pathological complete response in gastric cancer. This forest plot illustrates nine significant predictive factors for achieving pathological complete response after neoadjuvant chemotherapy in gastric cancer patients, with Lauren intestinal type and carcinoembryonic antigen decrease ≥ 70% showing the strongest associations (odds ratios of 3.75 and 3.86, respectively). All identified factors demonstrated statistically significant positive correlations with pathological complete response achievement (P < 0.05), providing potential clinical indicators to predict treatment response; B: Independent predictors of pathological complete response following neoadjuvant chemotherapy in gastric cancer. This forest plot illustrates five independent predictors of pathological complete response after neoadjuvant chemotherapy in gastric cancer patients, with carcinoembryonic antigen decrease ≥ 70% (odds ratio = 3.42) and Lauren intestinal type (odds ratio = 3.28) showing the strongest associations. All identified factors demonstrated statistically significant positive correlations with pathological complete response achievement (P < 0.05), providing potential clinical indicators to predict treatment response and optimize patient selection for neoadjuvant therapy. CI: Confidence interval; OR: Odds ratio; CEA: Carcinoembryonic antigen; CA19-9: Carbohydrate antigen 19-9; NLR: Neutrophil-to-lymphocyte ratio; PLR: Platelet-to-lymphocyte ratio; pCR: Pathological complete response.
- Citation: Bi B, Liu C, Chai J, Duan YM. Retrospective analysis of predictive factors for pathological complete response after neoadjuvant chemotherapy in gastric cancer. World J Gastrointest Surg 2025; 17(10): 109700
- URL: https://www.wjgnet.com/1948-9366/full/v17/i10/109700.htm
- DOI: https://dx.doi.org/10.4240/wjgs.v17.i10.109700