
















©The Author(s) 2025.
World J Gastrointest Surg. Oct 27, 2025; 17(10): 109700
Published online Oct 27, 2025. doi: 10.4240/wjgs.v17.i10.109700
Published online Oct 27, 2025. doi: 10.4240/wjgs.v17.i10.109700
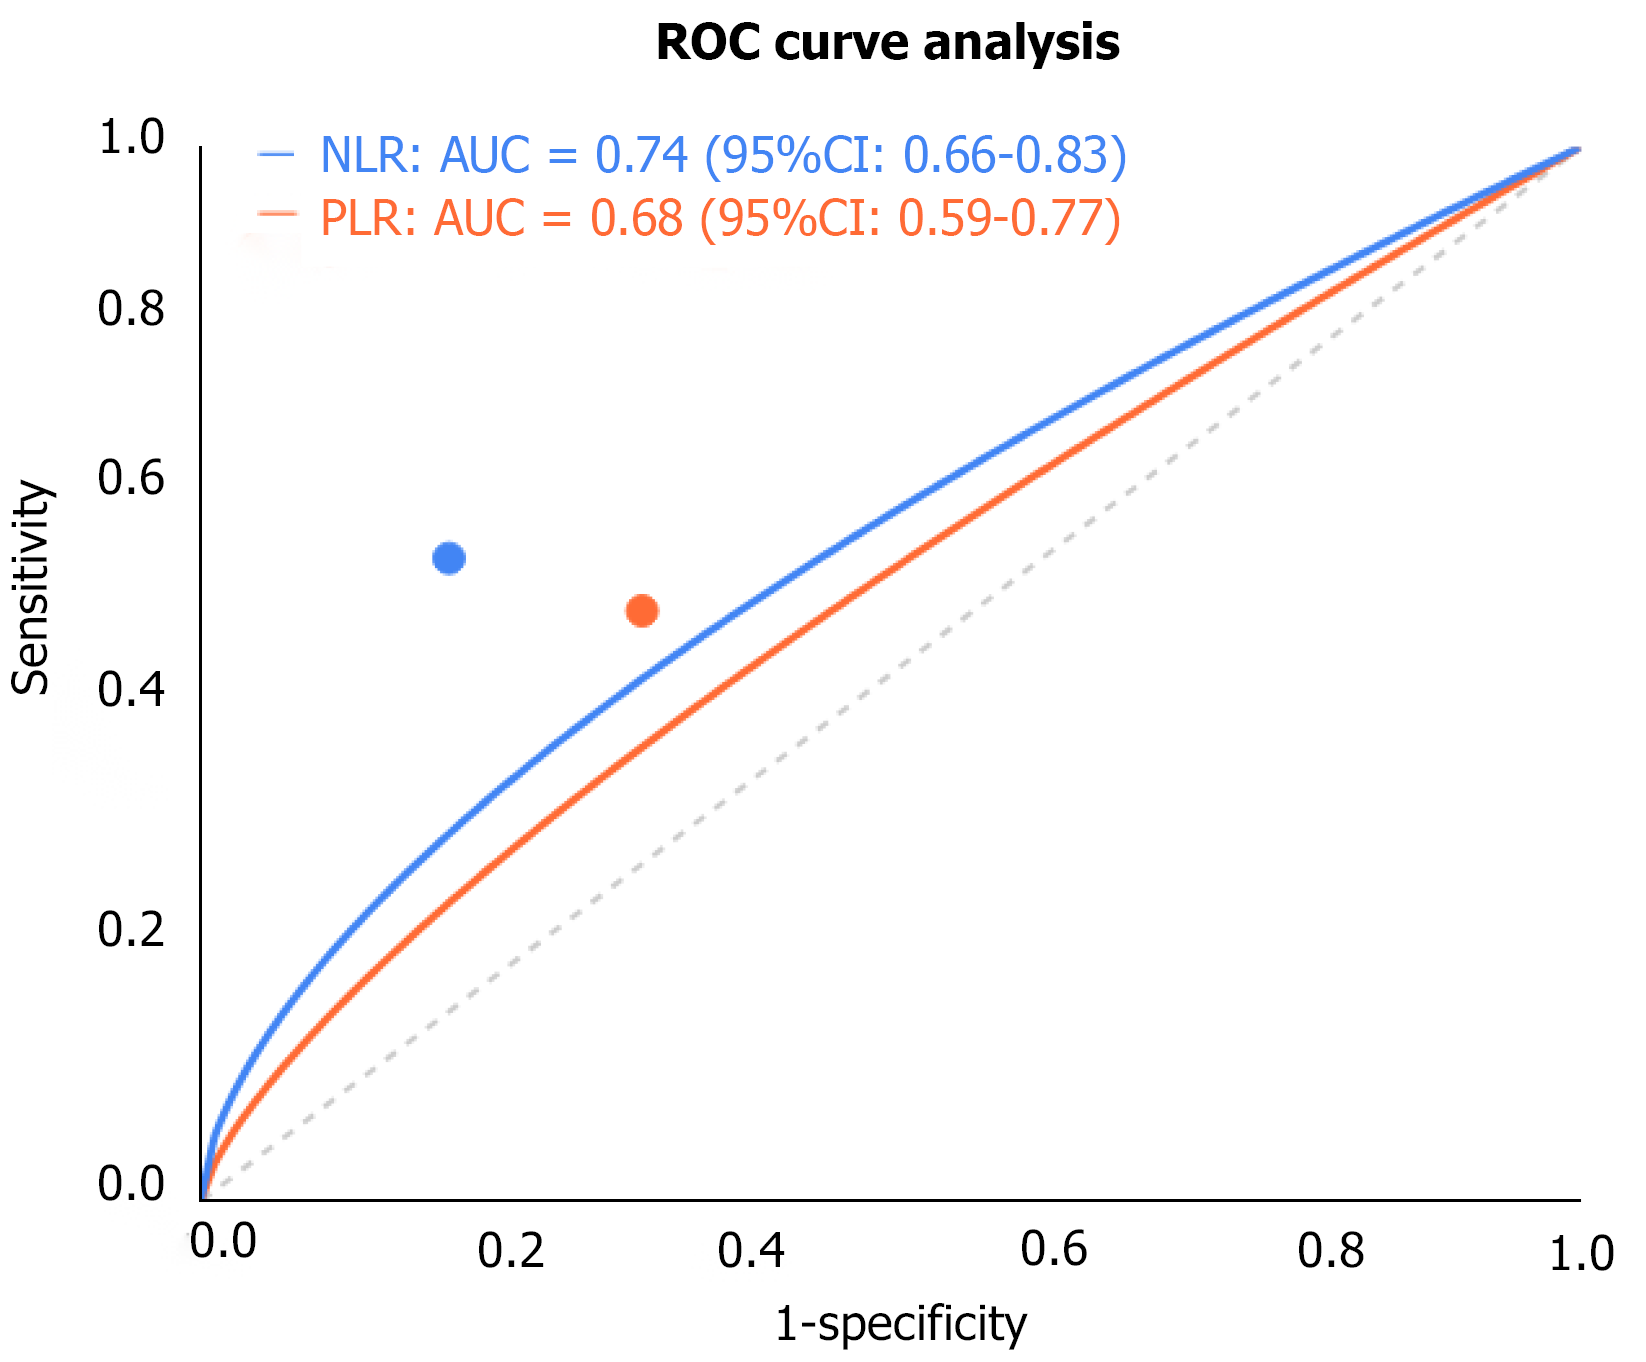
Figure 1 Receiver operating characteristic curve analysis of neutrophil-to-lymphocyte ratio, platelet-to-lymphocyte ratio for predicting pathological complete response.
Figure shows the receiver operating characteristic curves of neutrophil-to-lymphocyte ratio and platelet-to-lymphocyte ratio for predicting pathological complete response, with neutrophil-to-lymphocyte ratio (areas under the curve = 0.74) demonstrating better predictive value than platelet-to-lymphocyte ratio (areas under the curve = 0.68), and optimal cutoff values of 2.5 and 135, respectively. NLR: Neutrophil-to-lymphocyte ratio; PLR: Platelet-to-lymphocyte ratio; ROC: Receiver operating characteristic; AUC: Areas under the curve; CI: Confidence interval.
- Citation: Bi B, Liu C, Chai J, Duan YM. Retrospective analysis of predictive factors for pathological complete response after neoadjuvant chemotherapy in gastric cancer. World J Gastrointest Surg 2025; 17(10): 109700
- URL: https://www.wjgnet.com/1948-9366/full/v17/i10/109700.htm
- DOI: https://dx.doi.org/10.4240/wjgs.v17.i10.109700