Copyright
©The Author(s) 2024.
World J Gastrointest Surg. Feb 27, 2024; 16(2): 289-306
Published online Feb 27, 2024. doi: 10.4240/wjgs.v16.i2.289
Published online Feb 27, 2024. doi: 10.4240/wjgs.v16.i2.289
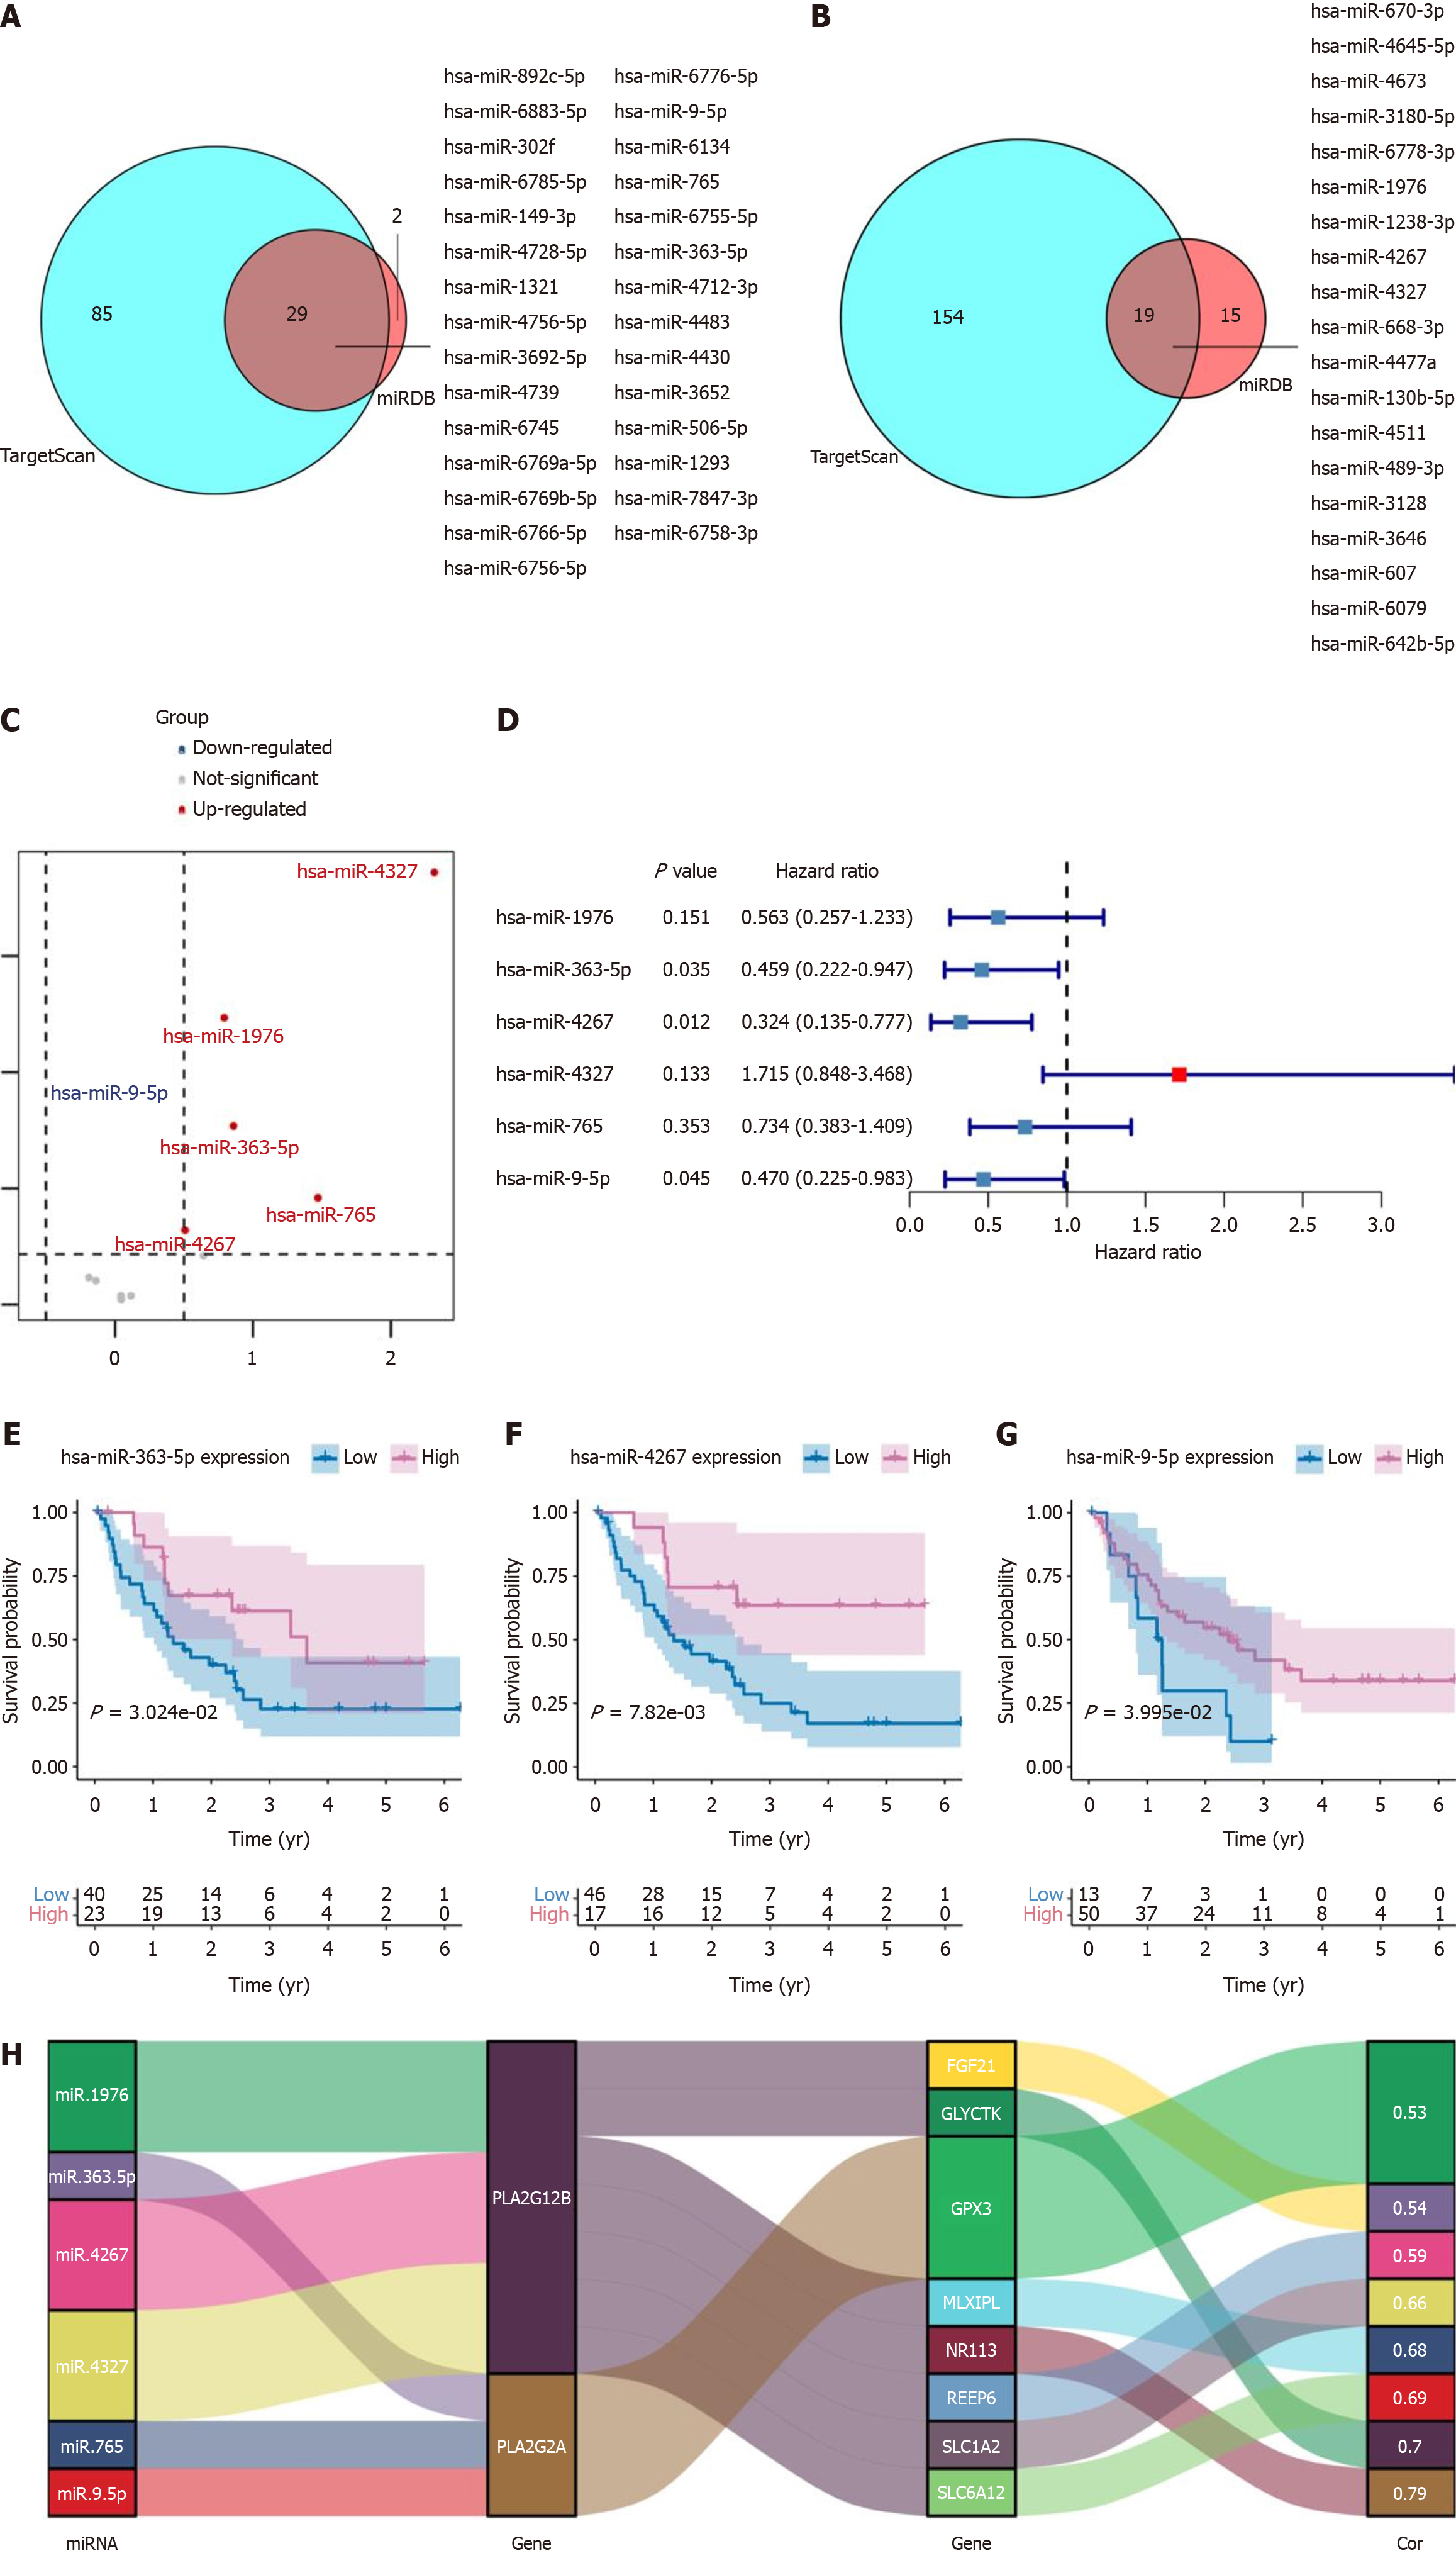
Figure 4 Analysis of microRNA targets in tumor vs normal samples and their prognostic significance in cancer.
A: Using TargetScan and miRDB databases, 29 intersecting microRNA (miRNA) targets for the PLA2G2A gene; B: Using TargetScan and miRDB databases, 19 intersecting miRNA targets for the PLA2G12B gene; C: Differentially expressed genes between miRNA targets in tumor and normal samples were shown in the volcano plot; D: Forest plot of the univariate Cox regression analysis in co-intersection miRNA targets; E-G: High expression of hsa-miR-363-5p, hsa-miR-4267, and hsa-miR-9-5p genes was associated with a worse prognosis; H: Sankey diagram visual analysis of miRNA targets, PLA2G2A, PLA2G12B, and Hub gene network data.
- Citation: Qiu C, Xiang YK, Da XB, Zhang HL, Kong XY, Hou NZ, Zhang C, Tian FZ, Yang YL. Phospholipase A2 enzymes PLA2G2A and PLA2G12B as potential diagnostic and prognostic biomarkers in cholangiocarcinoma. World J Gastrointest Surg 2024; 16(2): 289-306
- URL: https://www.wjgnet.com/1948-9366/full/v16/i2/289.htm
- DOI: https://dx.doi.org/10.4240/wjgs.v16.i2.289


