
















©The Author(s) 2024.
World J Gastrointest Surg. Nov 27, 2024; 16(11): 3484-3498
Published online Nov 27, 2024. doi: 10.4240/wjgs.v16.i11.3484
Published online Nov 27, 2024. doi: 10.4240/wjgs.v16.i11.3484
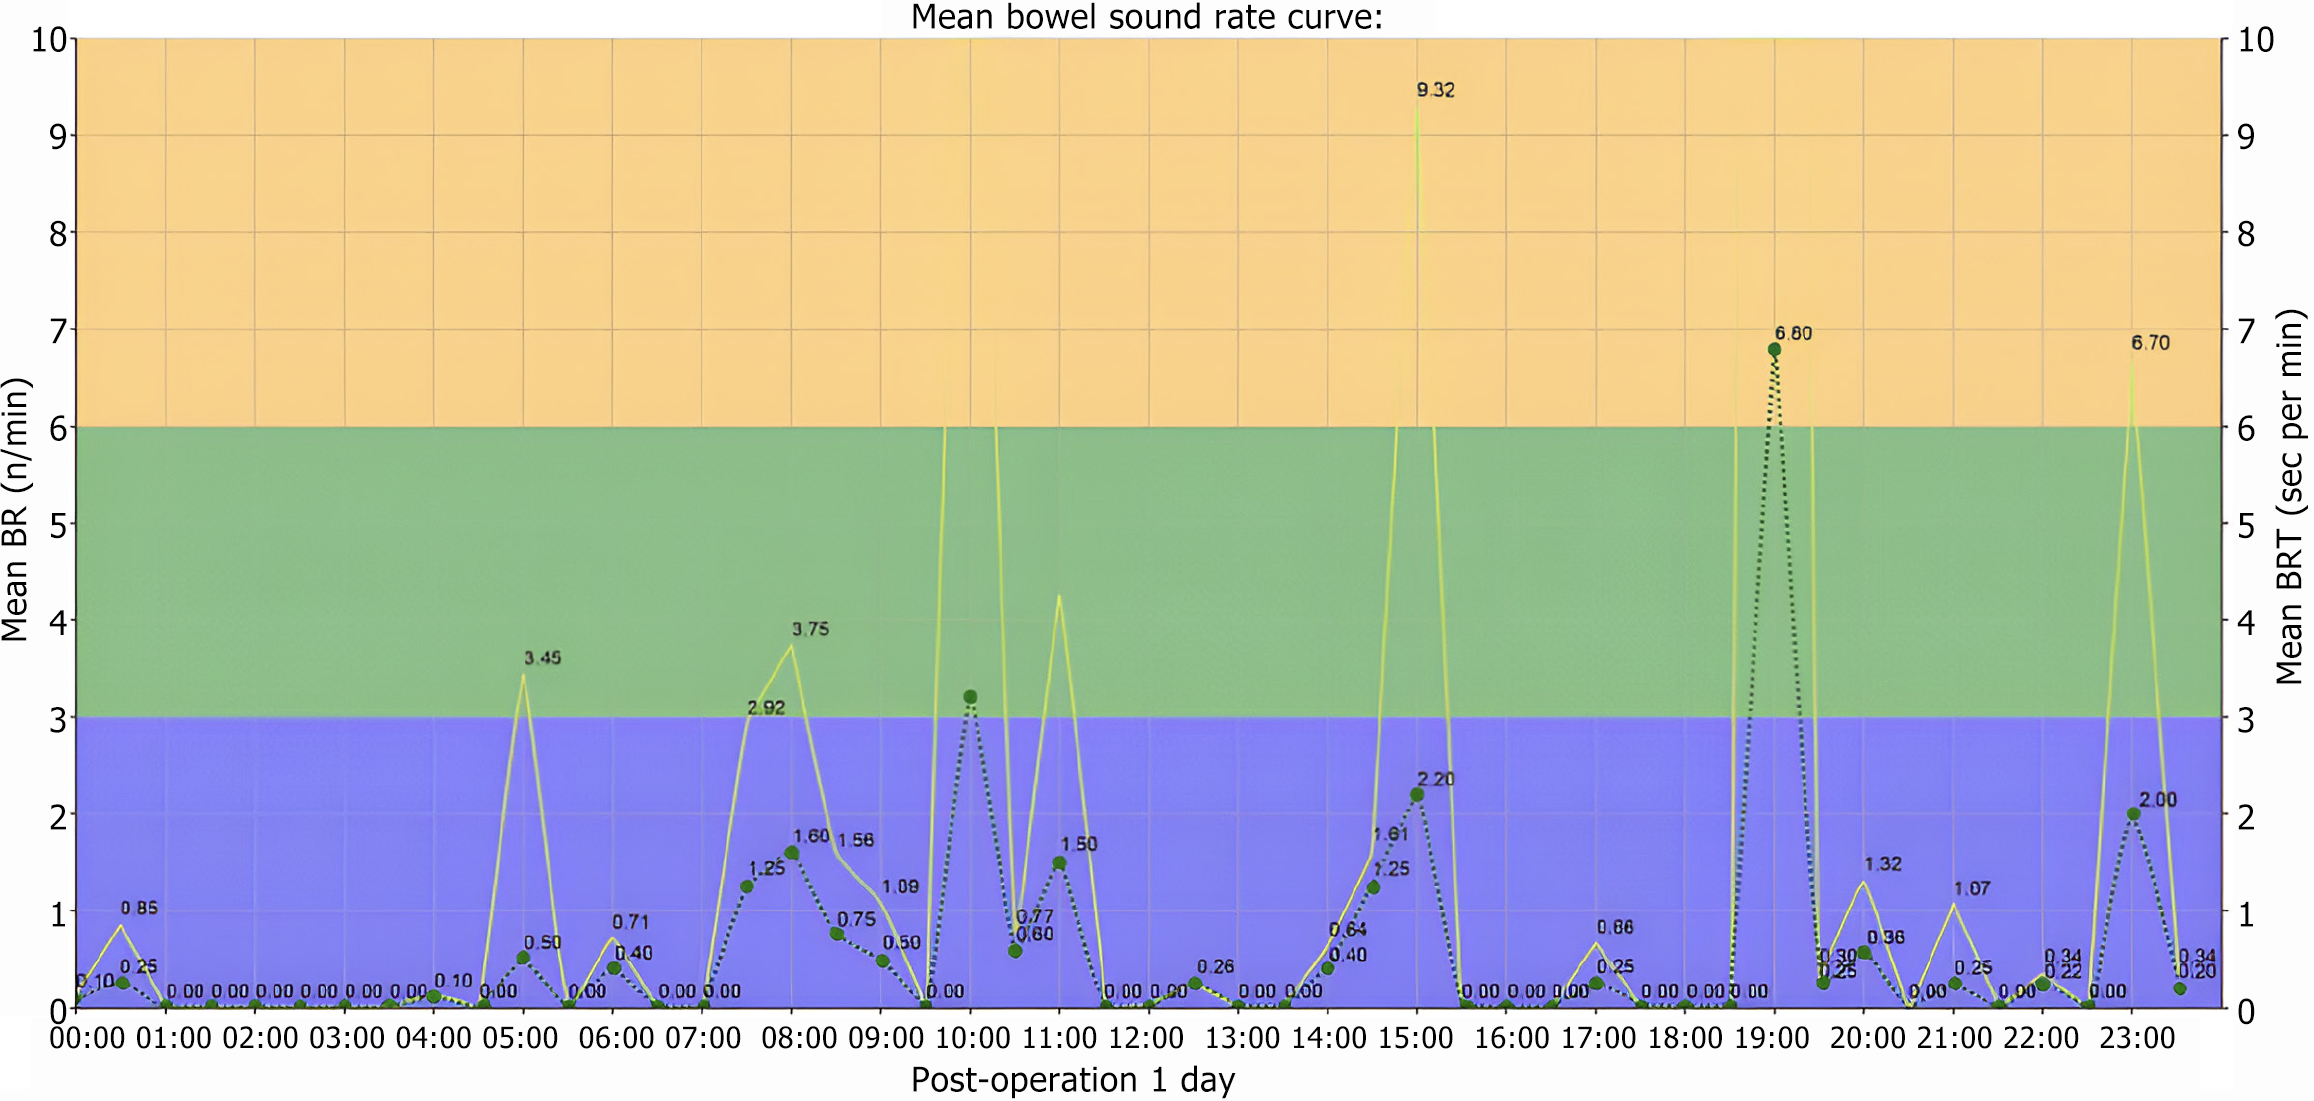
Figure 3 Bowel rate on first postoperative day.
The yellow area represents the area of hyperactive bowel sounds, green represents the area of normal bowel sounds, and blue represents the area of diminished bowel sounds. BR: Bowel rate.
- Citation: Shi S, Lu C, Shan L, Yan L, Liang Y, Feng T, Chen Z, Chen X, Wu X, Liu SD, Duan XL, Wang ZZ. Predicting prolonged postoperative ileus in gastric cancer patients based on bowel sounds using intelligent auscultation and machine learning. World J Gastrointest Surg 2024; 16(11): 3484-3498
- URL: https://www.wjgnet.com/1948-9366/full/v16/i11/3484.htm
- DOI: https://dx.doi.org/10.4240/wjgs.v16.i11.3484