
















©The Author(s) 2023.
World J Gastrointest Surg. Jul 27, 2023; 15(7): 1532-1541
Published online Jul 27, 2023. doi: 10.4240/wjgs.v15.i7.1532
Published online Jul 27, 2023. doi: 10.4240/wjgs.v15.i7.1532
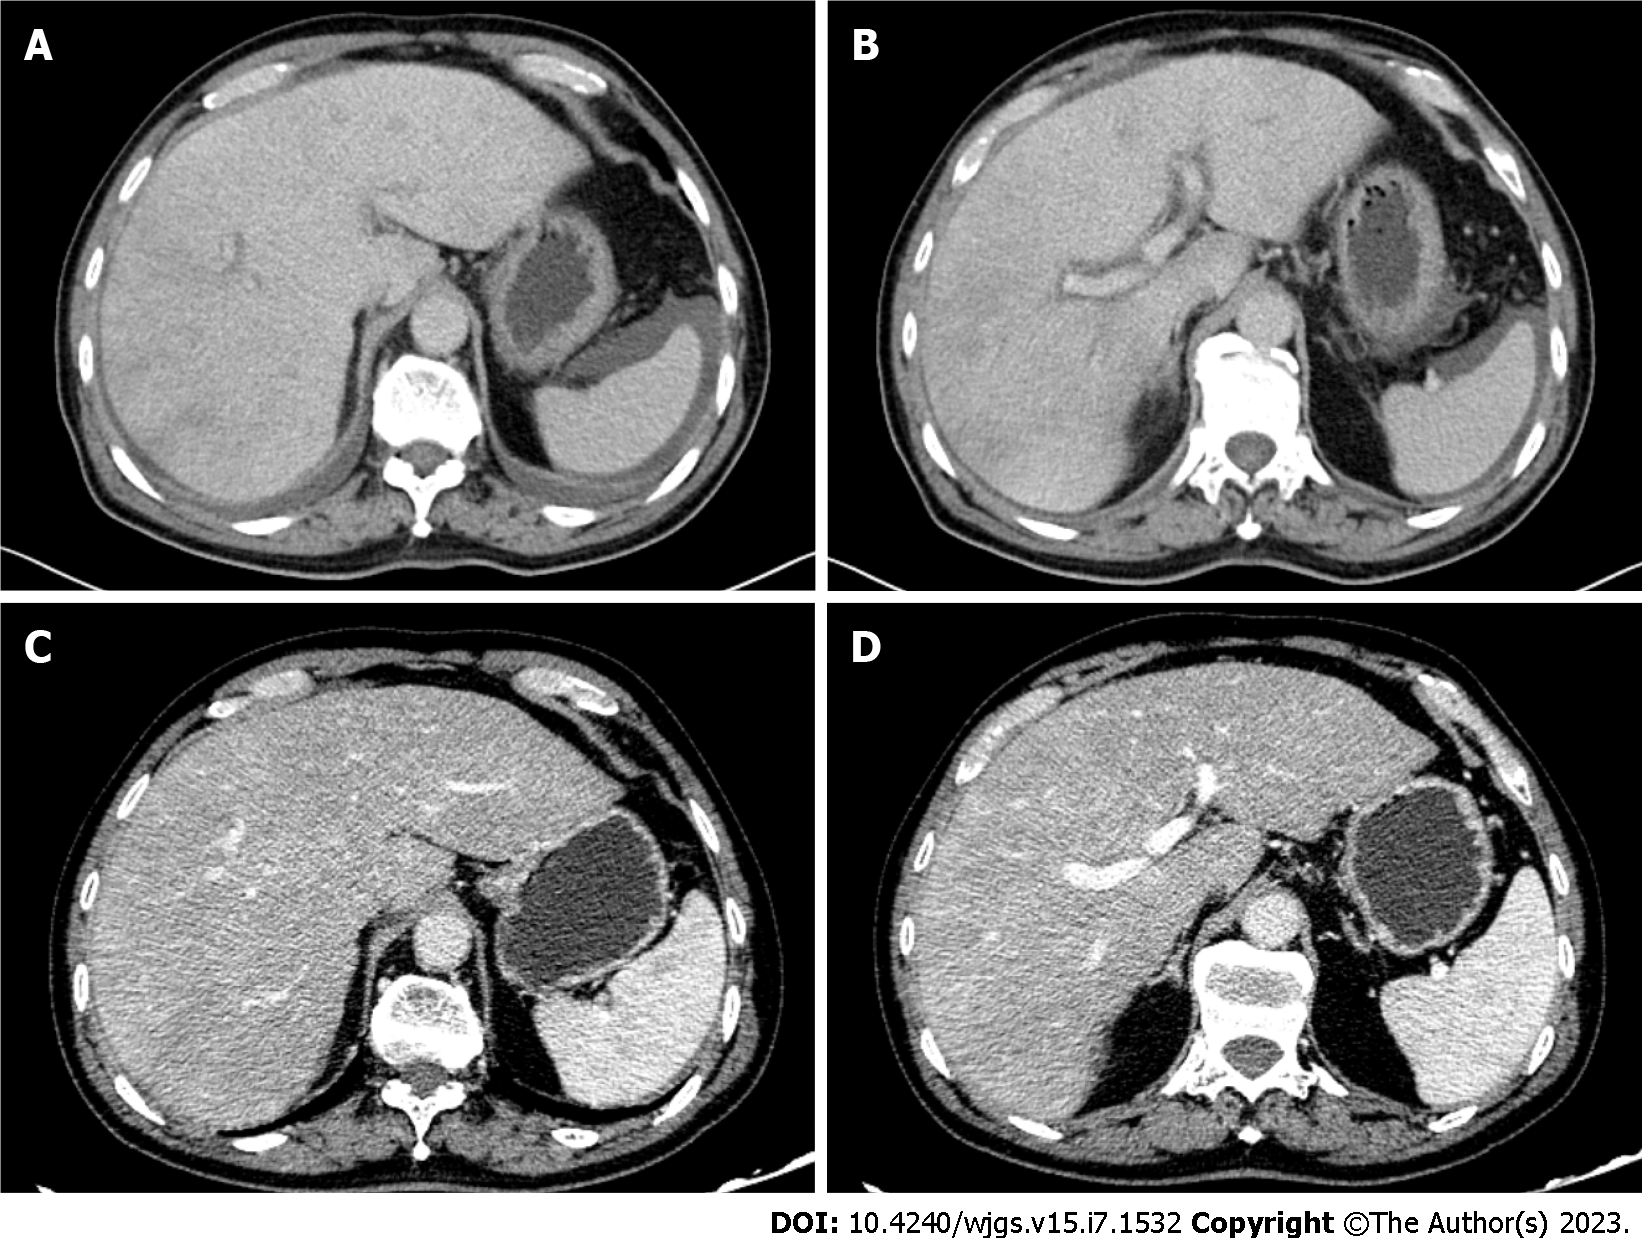
Figure 2 Contrast-enhanced computed tomography images of the upper abdomen of the patient.
A and B: Pretreatment enhanced computed tomography (CT) showed edema around the portal branch and fine compressed flattening of the inferior hepatic segment and hepatic veins with ascites; C and D: Post-treatment enhanced CT showed that the inferior vena cava and hepatic veins of the hepatic segment were thin, and congestion of the hepatic venules was improved.
- Citation: Xu XT, Wang BH, Wang Q, Guo YJ, Zhang YN, Chen XL, Fang YF, Wang K, Guo WH, Wen ZZ. Idiopathic hypereosinophilic syndrome with hepatic sinusoidal obstruction syndrome: A case report and literature review. World J Gastrointest Surg 2023; 15(7): 1532-1541
- URL: https://www.wjgnet.com/1948-9366/full/v15/i7/1532.htm
- DOI: https://dx.doi.org/10.4240/wjgs.v15.i7.1532