Copyright
©The Author(s) 2022.
World J Gastrointest Surg. Sep 27, 2022; 14(9): 940-949
Published online Sep 27, 2022. doi: 10.4240/wjgs.v14.i9.940
Published online Sep 27, 2022. doi: 10.4240/wjgs.v14.i9.940
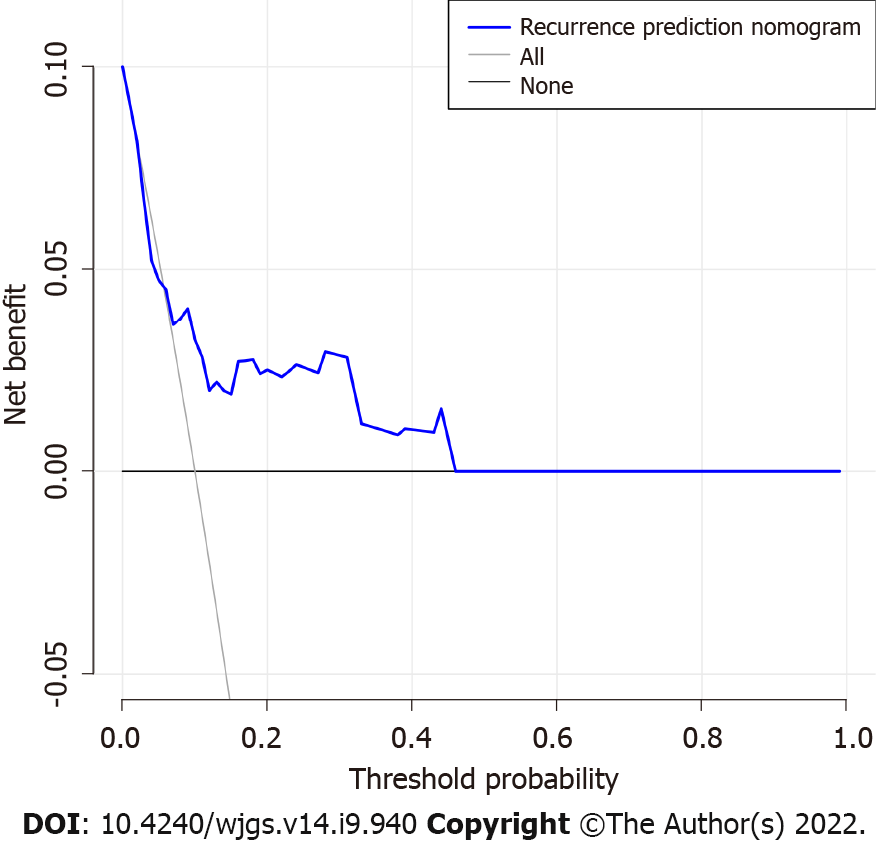
Figure 4 Decision curve analysis of the recurrence nomogram.
The y-axis represents the net benefit. The blue line represents the gastrointestinal stromal tumor (GIST) recurrence risk nomogram. The solid line indicates the hypothesis that all patients have recurrence. The thick solid line indicates the assumption that there is no patient recurrence. The decision curve shows that if the threshold probability is > 5% and < 100%, the recurrence nomogram in the current study can be used to predict the risk of recurrence of GIST and adds more benefit than the intervention-all-patients regimen or the intervention-none regimen.
- Citation: Guan SH, Wang Q, Ma XM, Qiao WJ, Li MZ, Lai MG, Wang C. Development of an innovative nomogram of risk factors to predict postoperative recurrence of gastrointestinal stromal tumors. World J Gastrointest Surg 2022; 14(9): 940-949
- URL: https://www.wjgnet.com/1948-9366/full/v14/i9/940.htm
- DOI: https://dx.doi.org/10.4240/wjgs.v14.i9.940


