Copyright
©The Author(s) 2022.
World J Gastrointest Surg. Sep 27, 2022; 14(9): 940-949
Published online Sep 27, 2022. doi: 10.4240/wjgs.v14.i9.940
Published online Sep 27, 2022. doi: 10.4240/wjgs.v14.i9.940
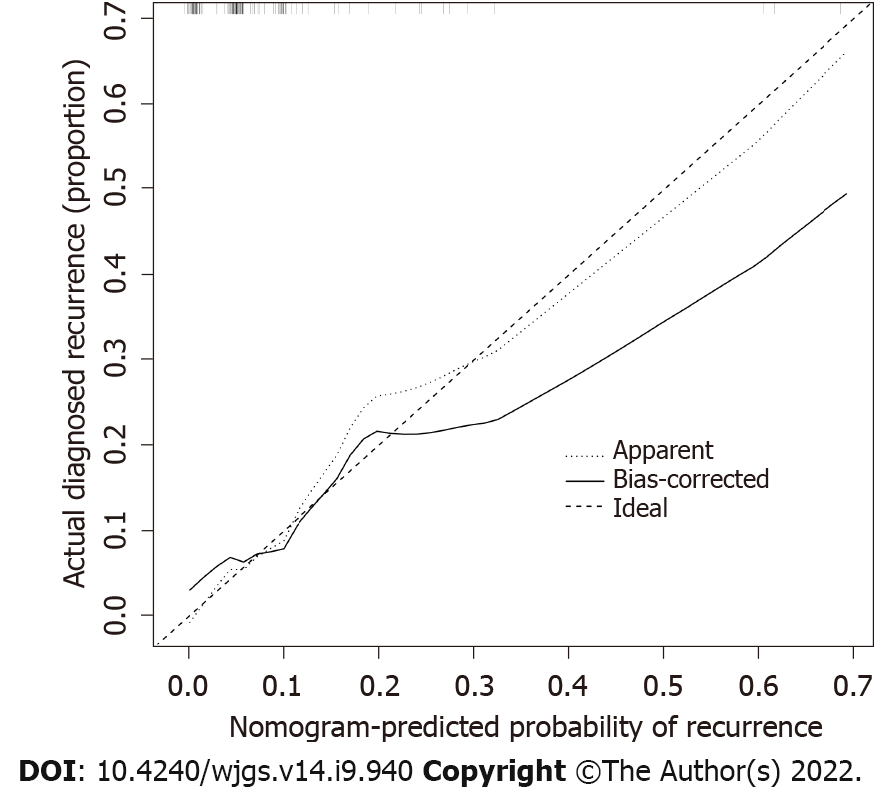
Figure 3 Calibration curves of the recurrence nomogram prediction.
The x-axis represents a possible risk of recurrence of gastrointestinal stromal tumor. The y-axis represents the actual recurrence. Diagonal dotted lines indicate predictions under ideal conditions. The solid line indicates the performance of the nomogram, and the closer it is to the diagonal dotted line, the more predictive the value is.
- Citation: Guan SH, Wang Q, Ma XM, Qiao WJ, Li MZ, Lai MG, Wang C. Development of an innovative nomogram of risk factors to predict postoperative recurrence of gastrointestinal stromal tumors. World J Gastrointest Surg 2022; 14(9): 940-949
- URL: https://www.wjgnet.com/1948-9366/full/v14/i9/940.htm
- DOI: https://dx.doi.org/10.4240/wjgs.v14.i9.940


