
















©The Author(s) 2019.
World J Gastrointest Surg. Mar 27, 2019; 11(3): 191-197
Published online Mar 27, 2019. doi: 10.4240/wjgs.v11.i3.191
Published online Mar 27, 2019. doi: 10.4240/wjgs.v11.i3.191
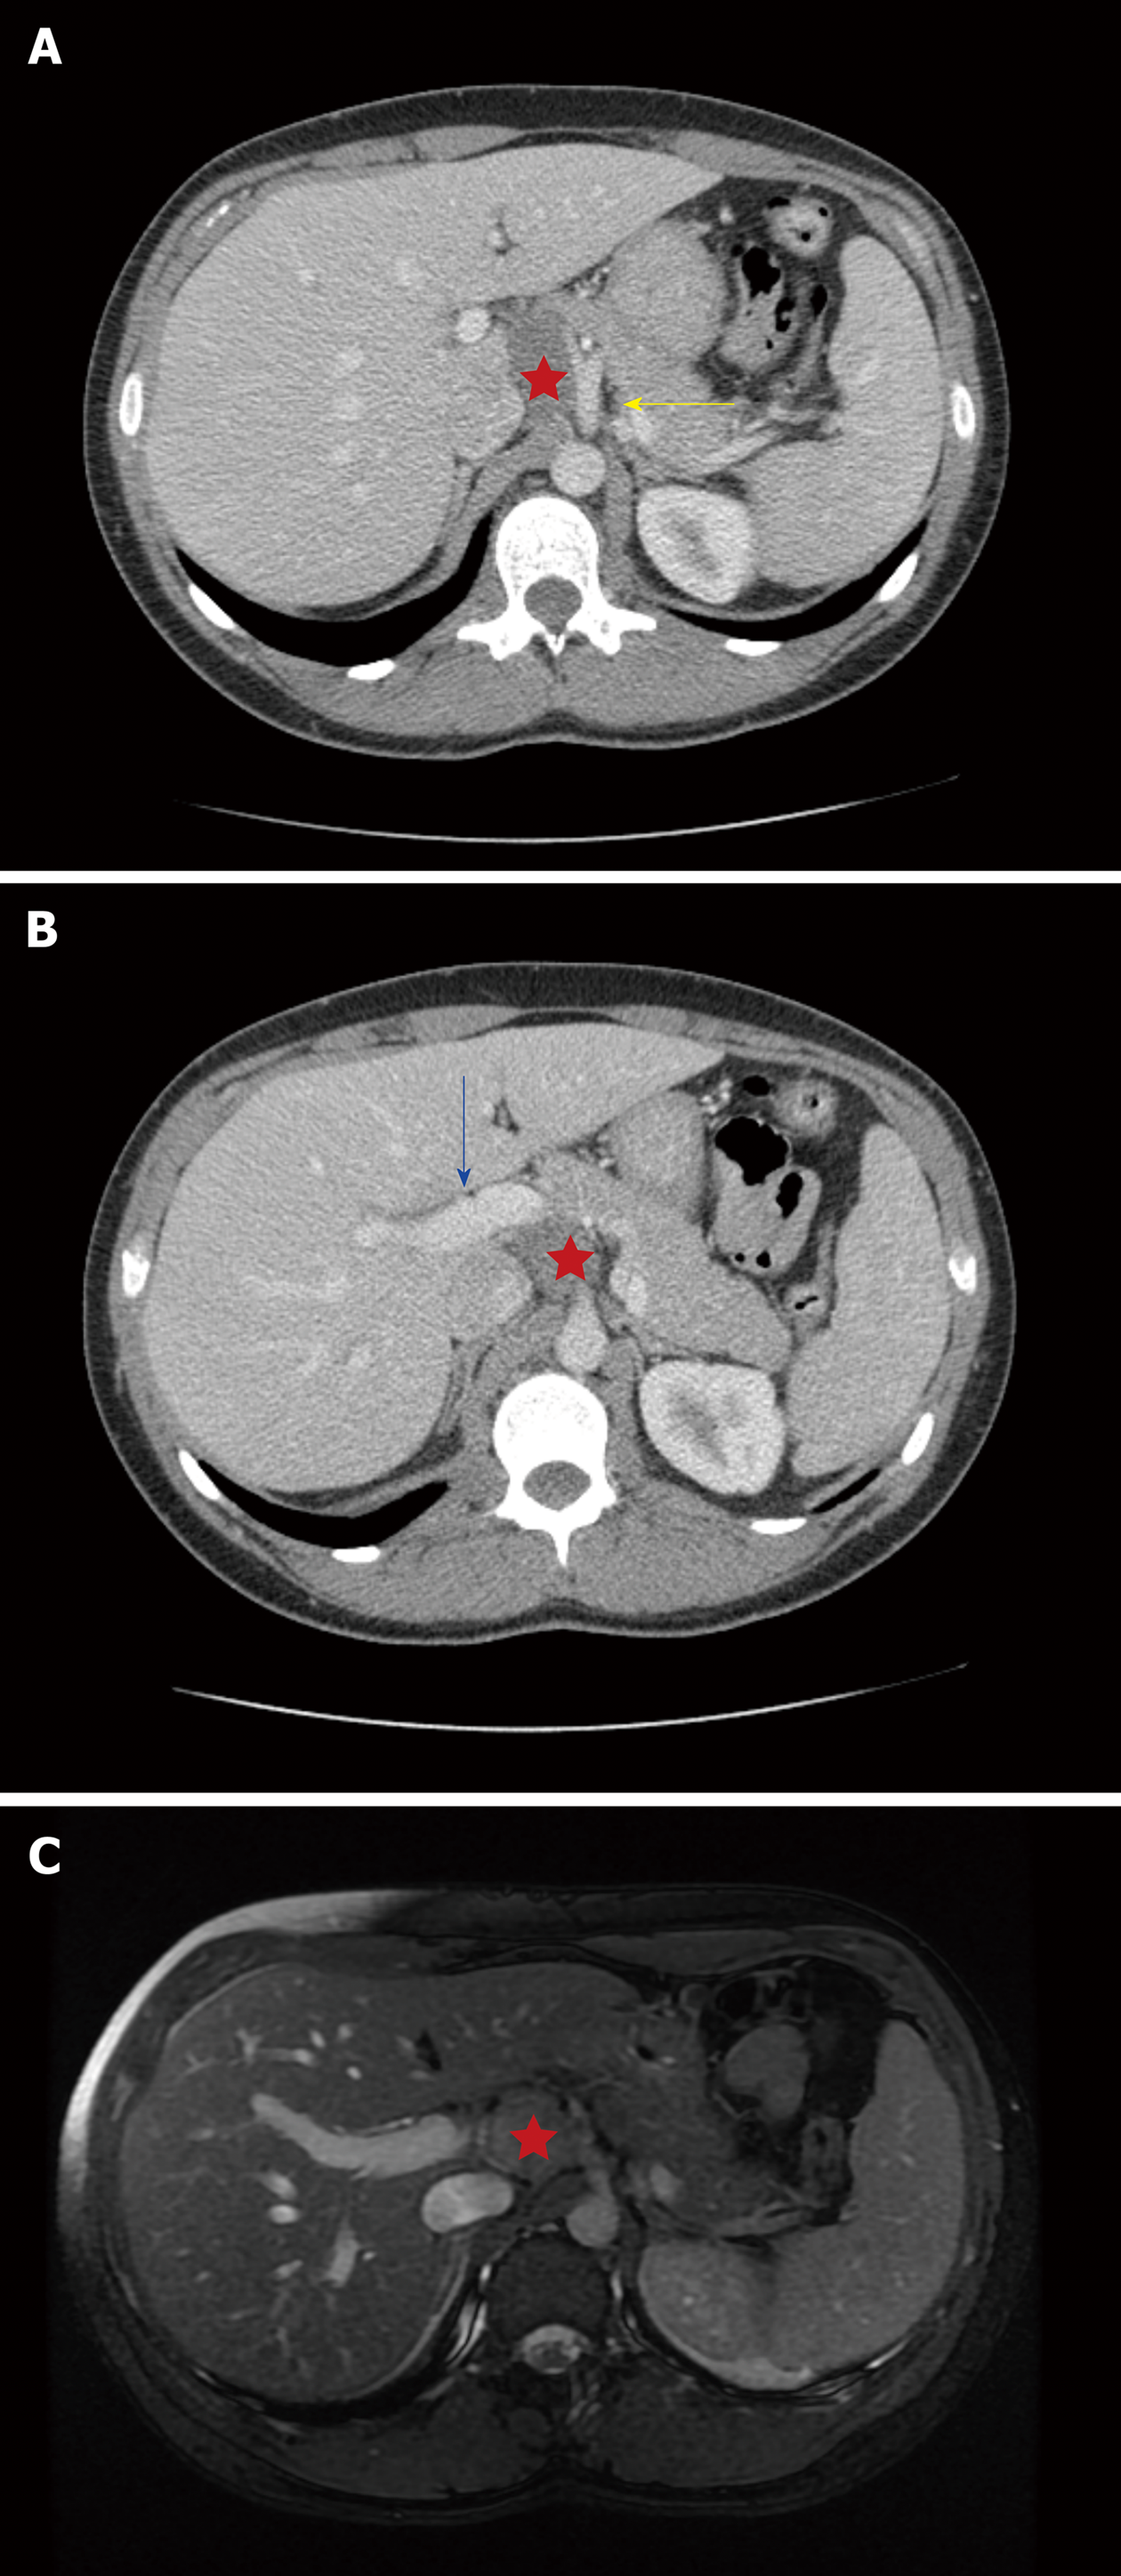
Figure 1 Axial computed tomography scan and magnetic resonance imaging.
A: Axial computed tomography (CT) scan: This axial CT image demonstrates the ganglioneuroma (red star) abutting the celiac axis (yellow arrow) and the caudate lobe of the liver; B: Axial CT scan: A more inferior axial CT cut demonstrates the inferomedial extension of the ganglioneuroma (red star) adjacent to the portal vein (blue arrow); C: Axial magnetic resonance imaging (MRI): This MRI image demonstrates the close proximity of the ganglioneuroma (red star) to the vital structures. However, there was no vascular encasement or invasion and fat planes were preserved.
- Citation: Hemmati P, Ghanem O, Bingener J. Laparoscopic celiac plexus ganglioneuroma resection: A video case report. World J Gastrointest Surg 2019; 11(3): 191-197
- URL: https://www.wjgnet.com/1948-9366/full/v11/i3/191.htm
- DOI: https://dx.doi.org/10.4240/wjgs.v11.i3.191