Copyright
©The Author(s) 2023.
World J Gastrointest Surg. May 27, 2023; 15(5): 882-891
Published online May 27, 2023. doi: 10.4240/wjgs.v15.i5.882
Published online May 27, 2023. doi: 10.4240/wjgs.v15.i5.882
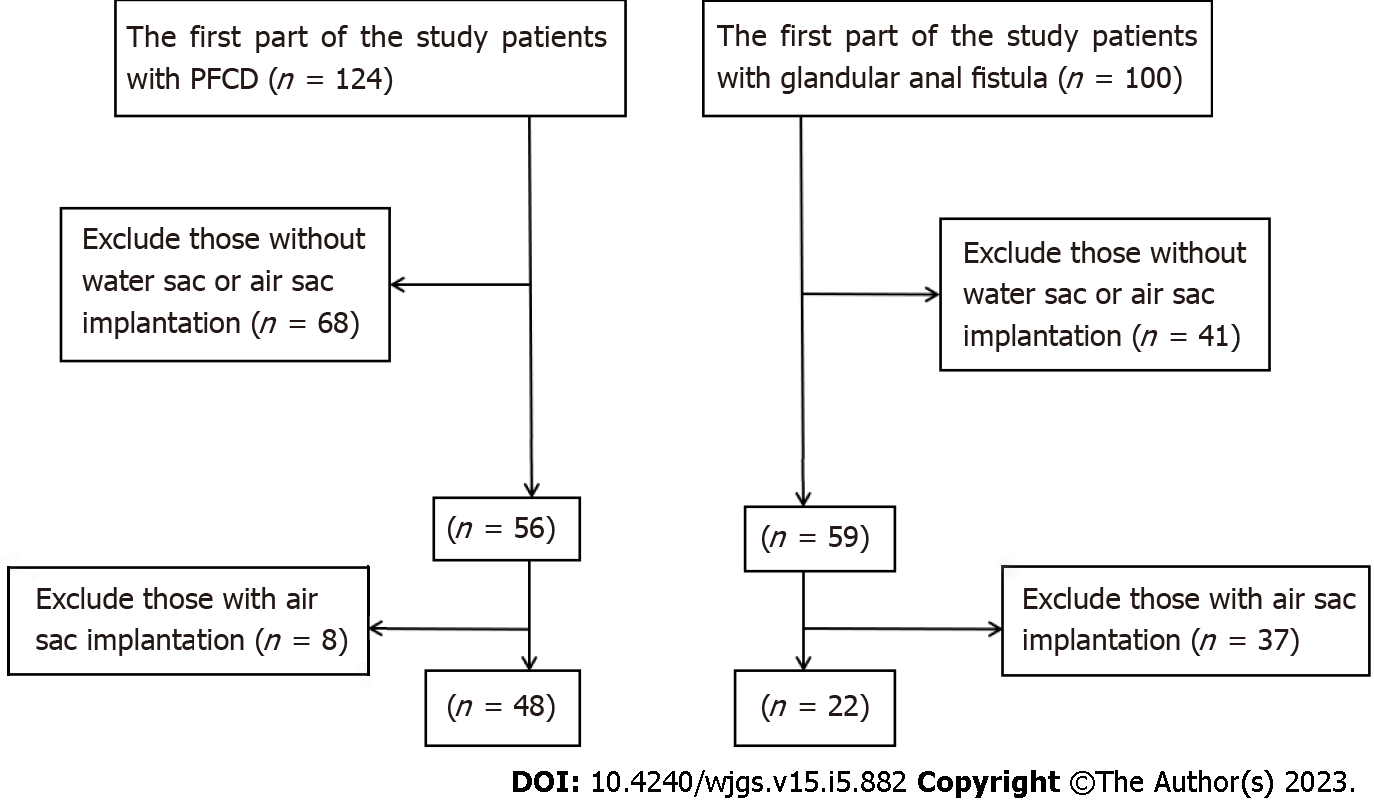
Figure 1 Flow chart of patient inclusion and exclusion.
PFCD: Perianal fistulising Crohn's disease.
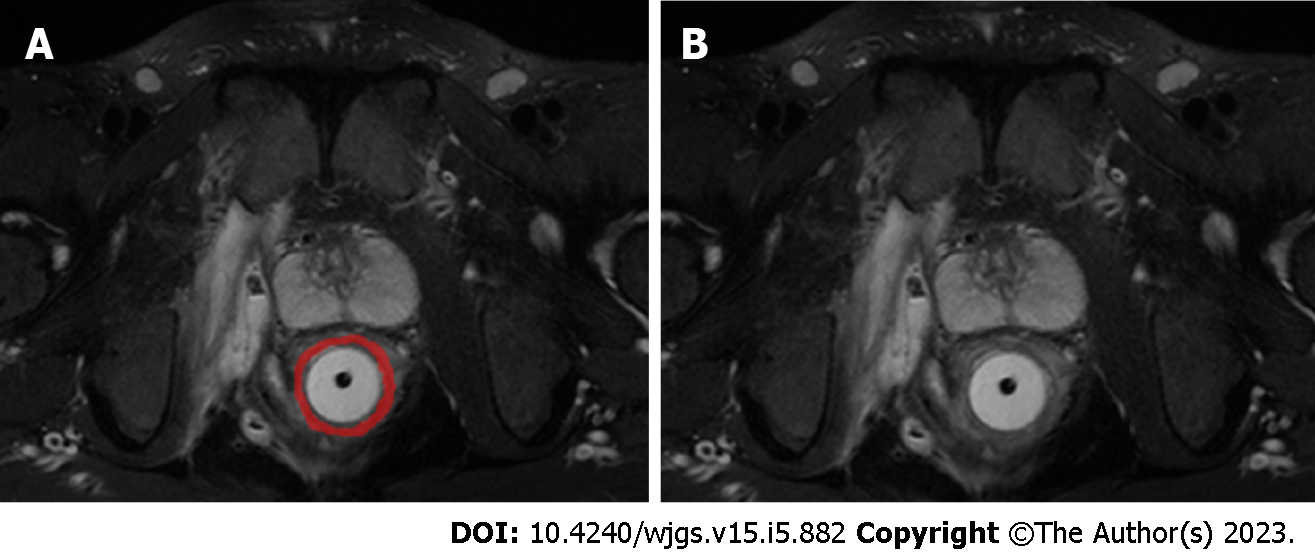
Figure 2 Region of interest sketch diagram.
A: The horizontal axis of fat suppression T2-weighted (FS-T2WI) image. The red part is the outlined region of interest. B: The horizontal axis of FS-T2WI image, on the same layer as figure panel A.
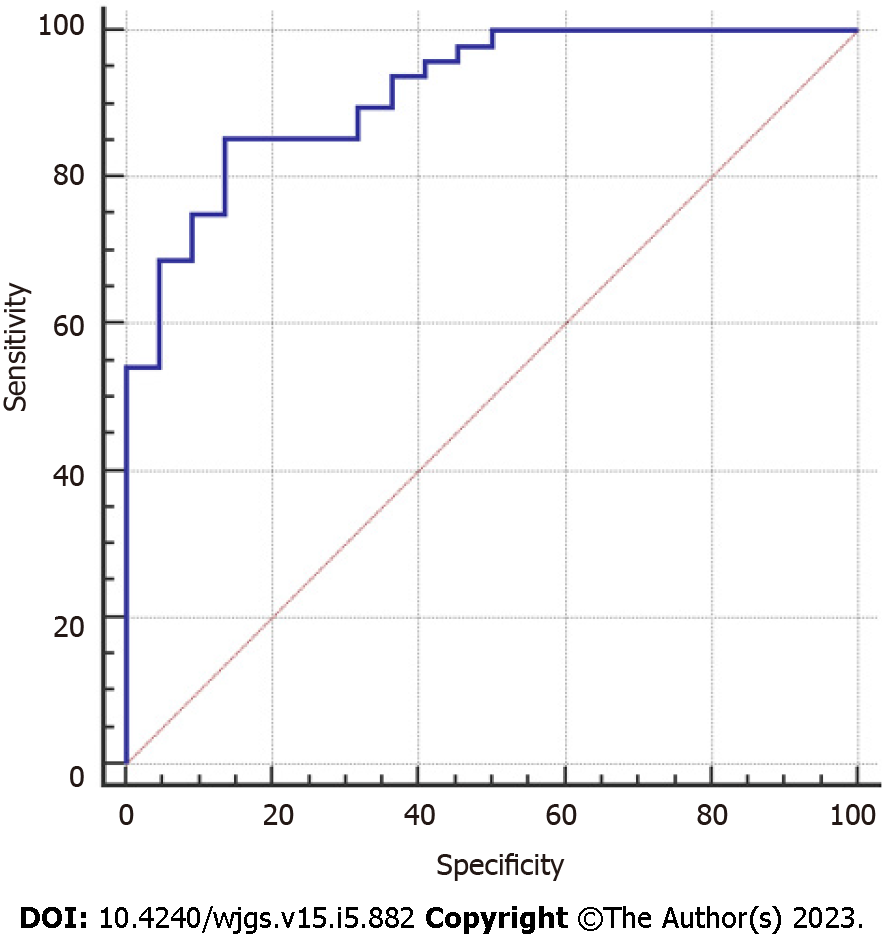
Figure 3 Receiver operating characteristic curve of the logistic regression model of textural feature parameters.
- Citation: Zhu X, Ye DD, Wang JH, Li J, Liu SW. Diagnostic performance of texture analysis in the differential diagnosis of perianal fistulising Crohn’s disease and glandular anal fistula. World J Gastrointest Surg 2023; 15(5): 882-891
- URL: https://www.wjgnet.com/1948-9366/full/v15/i5/882.htm
- DOI: https://dx.doi.org/10.4240/wjgs.v15.i5.882


