Copyright
©The Author(s) 2021.
World J Gastrointest Surg. Oct 27, 2021; 13(10): 1202-1215
Published online Oct 27, 2021. doi: 10.4240/wjgs.v13.i10.1202
Published online Oct 27, 2021. doi: 10.4240/wjgs.v13.i10.1202
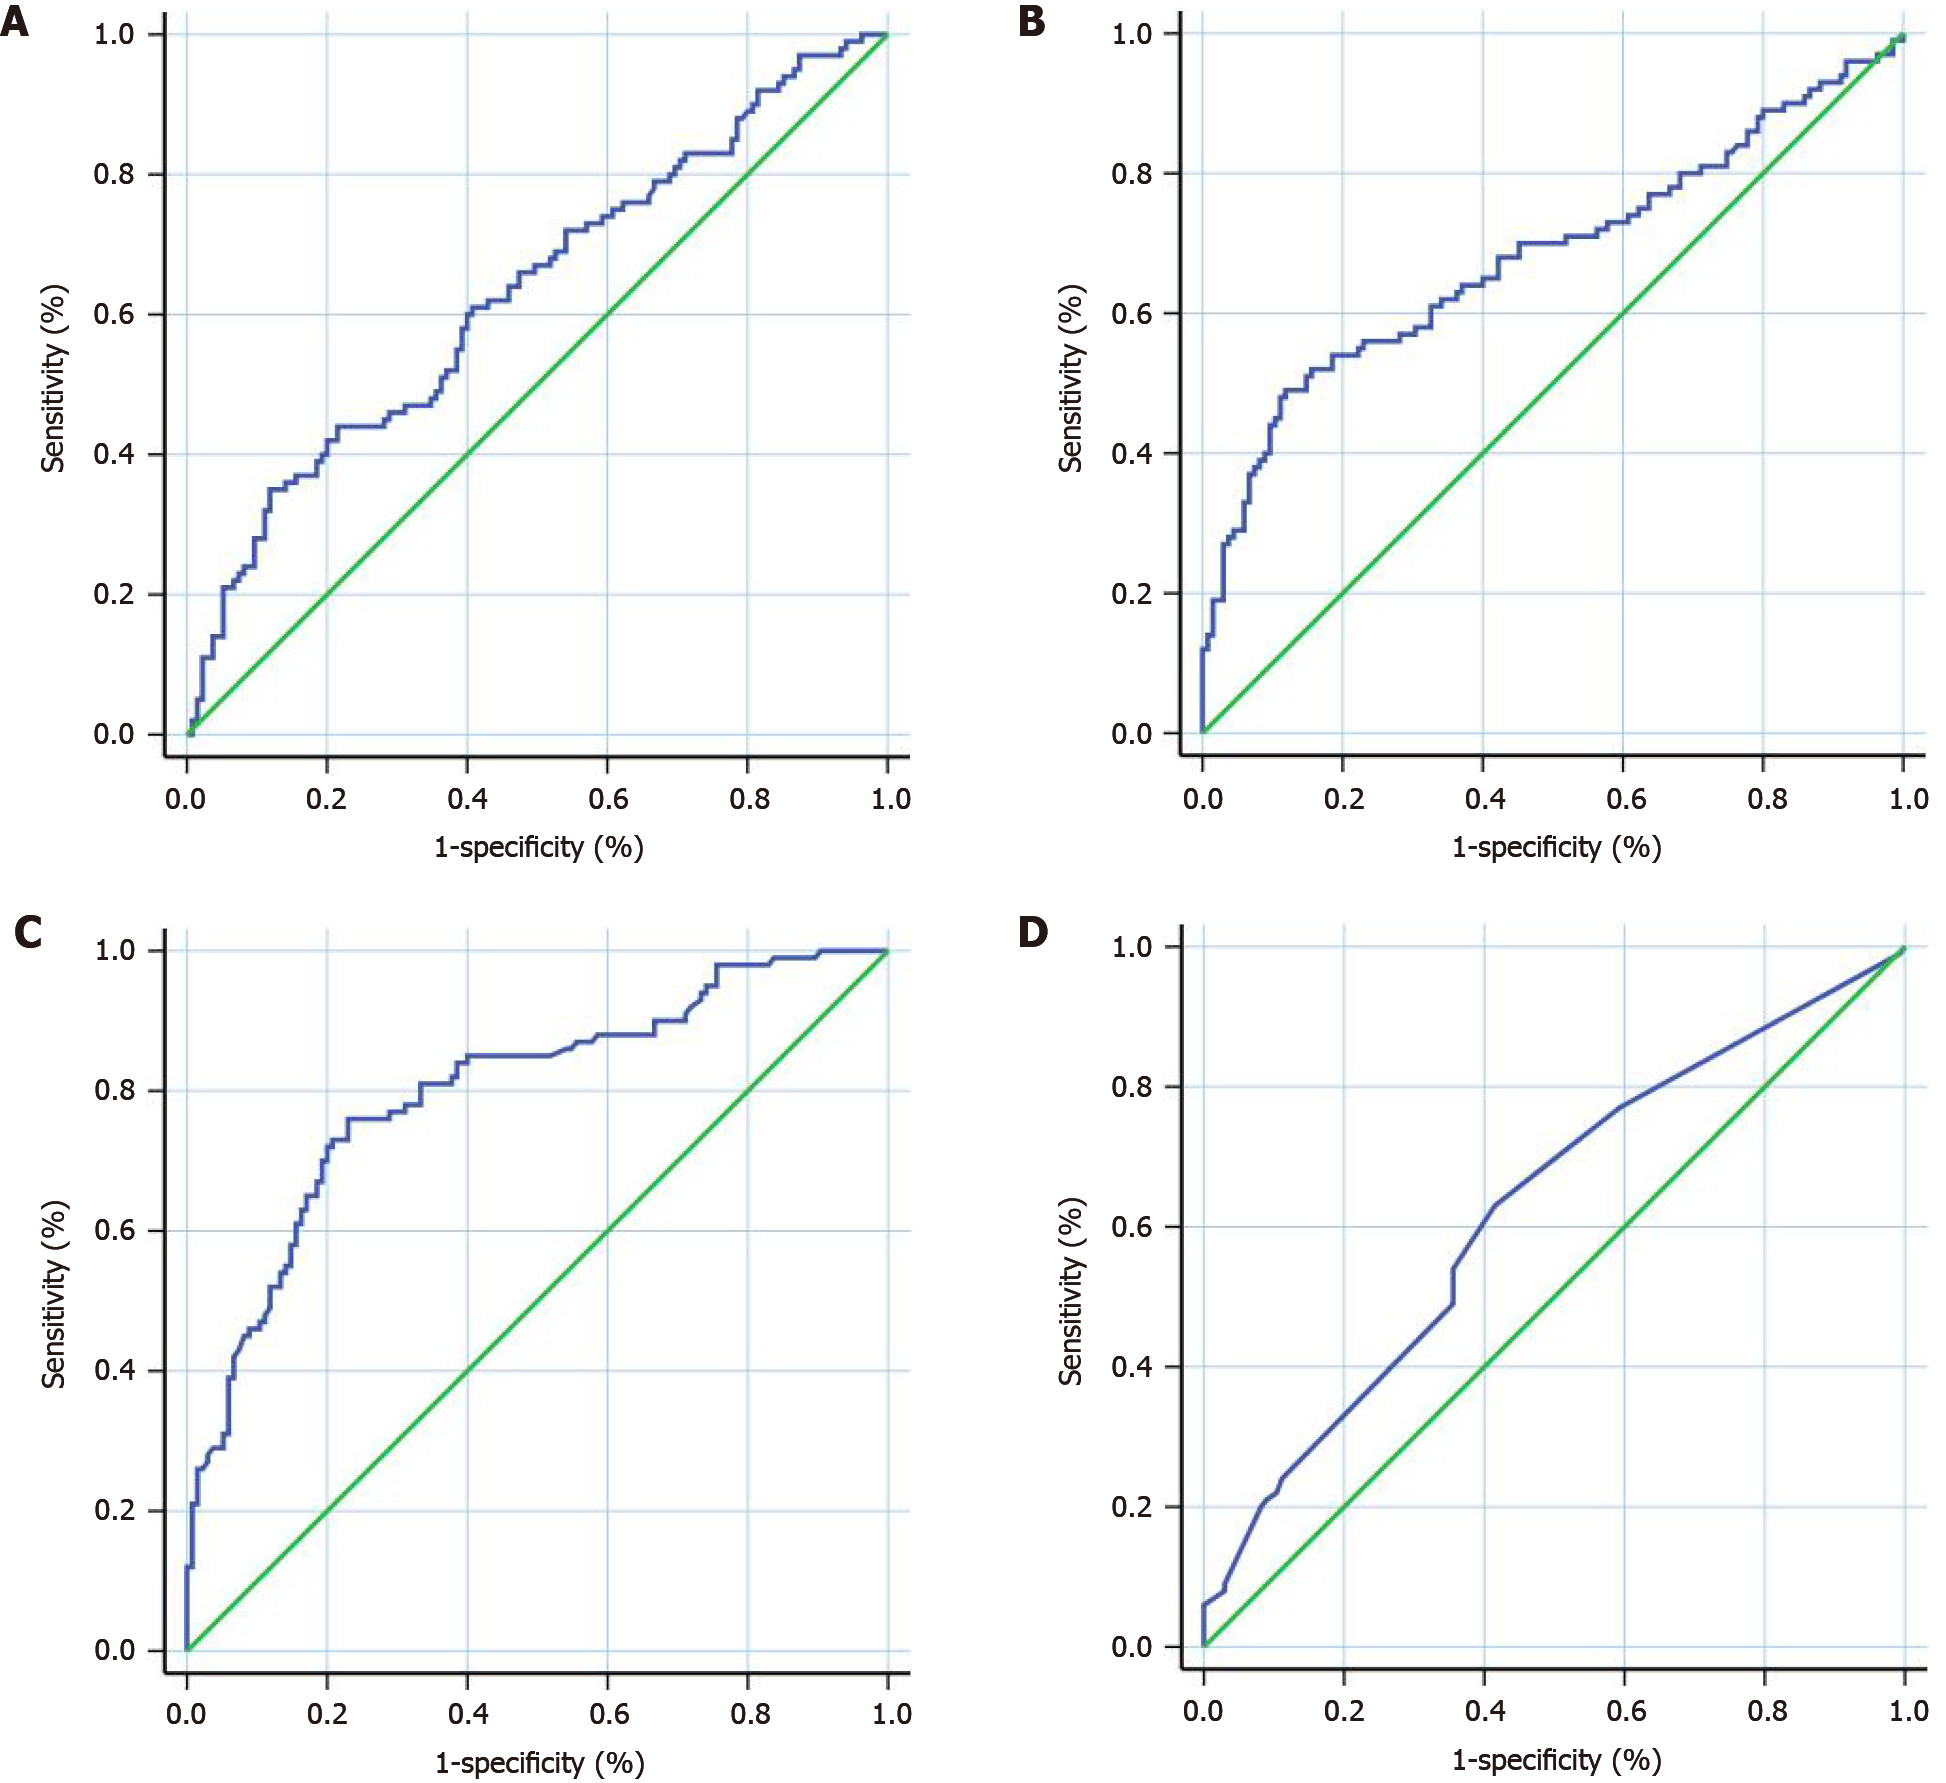
Figure 1 Receiver operator characteristic analysis of the neutrophil-to-lymphocyte ratio, platelet-to-lymphocyte ratio, Onodera’s Prognostic Nutritional Index, and Ki-67 index.
A: Neutrophil-to-lymphocyte ratio; B: Platelet-to-lymphocyte ratio; C: Onodera’s Prognostic Nutritional Index; D: Ki-67 index.
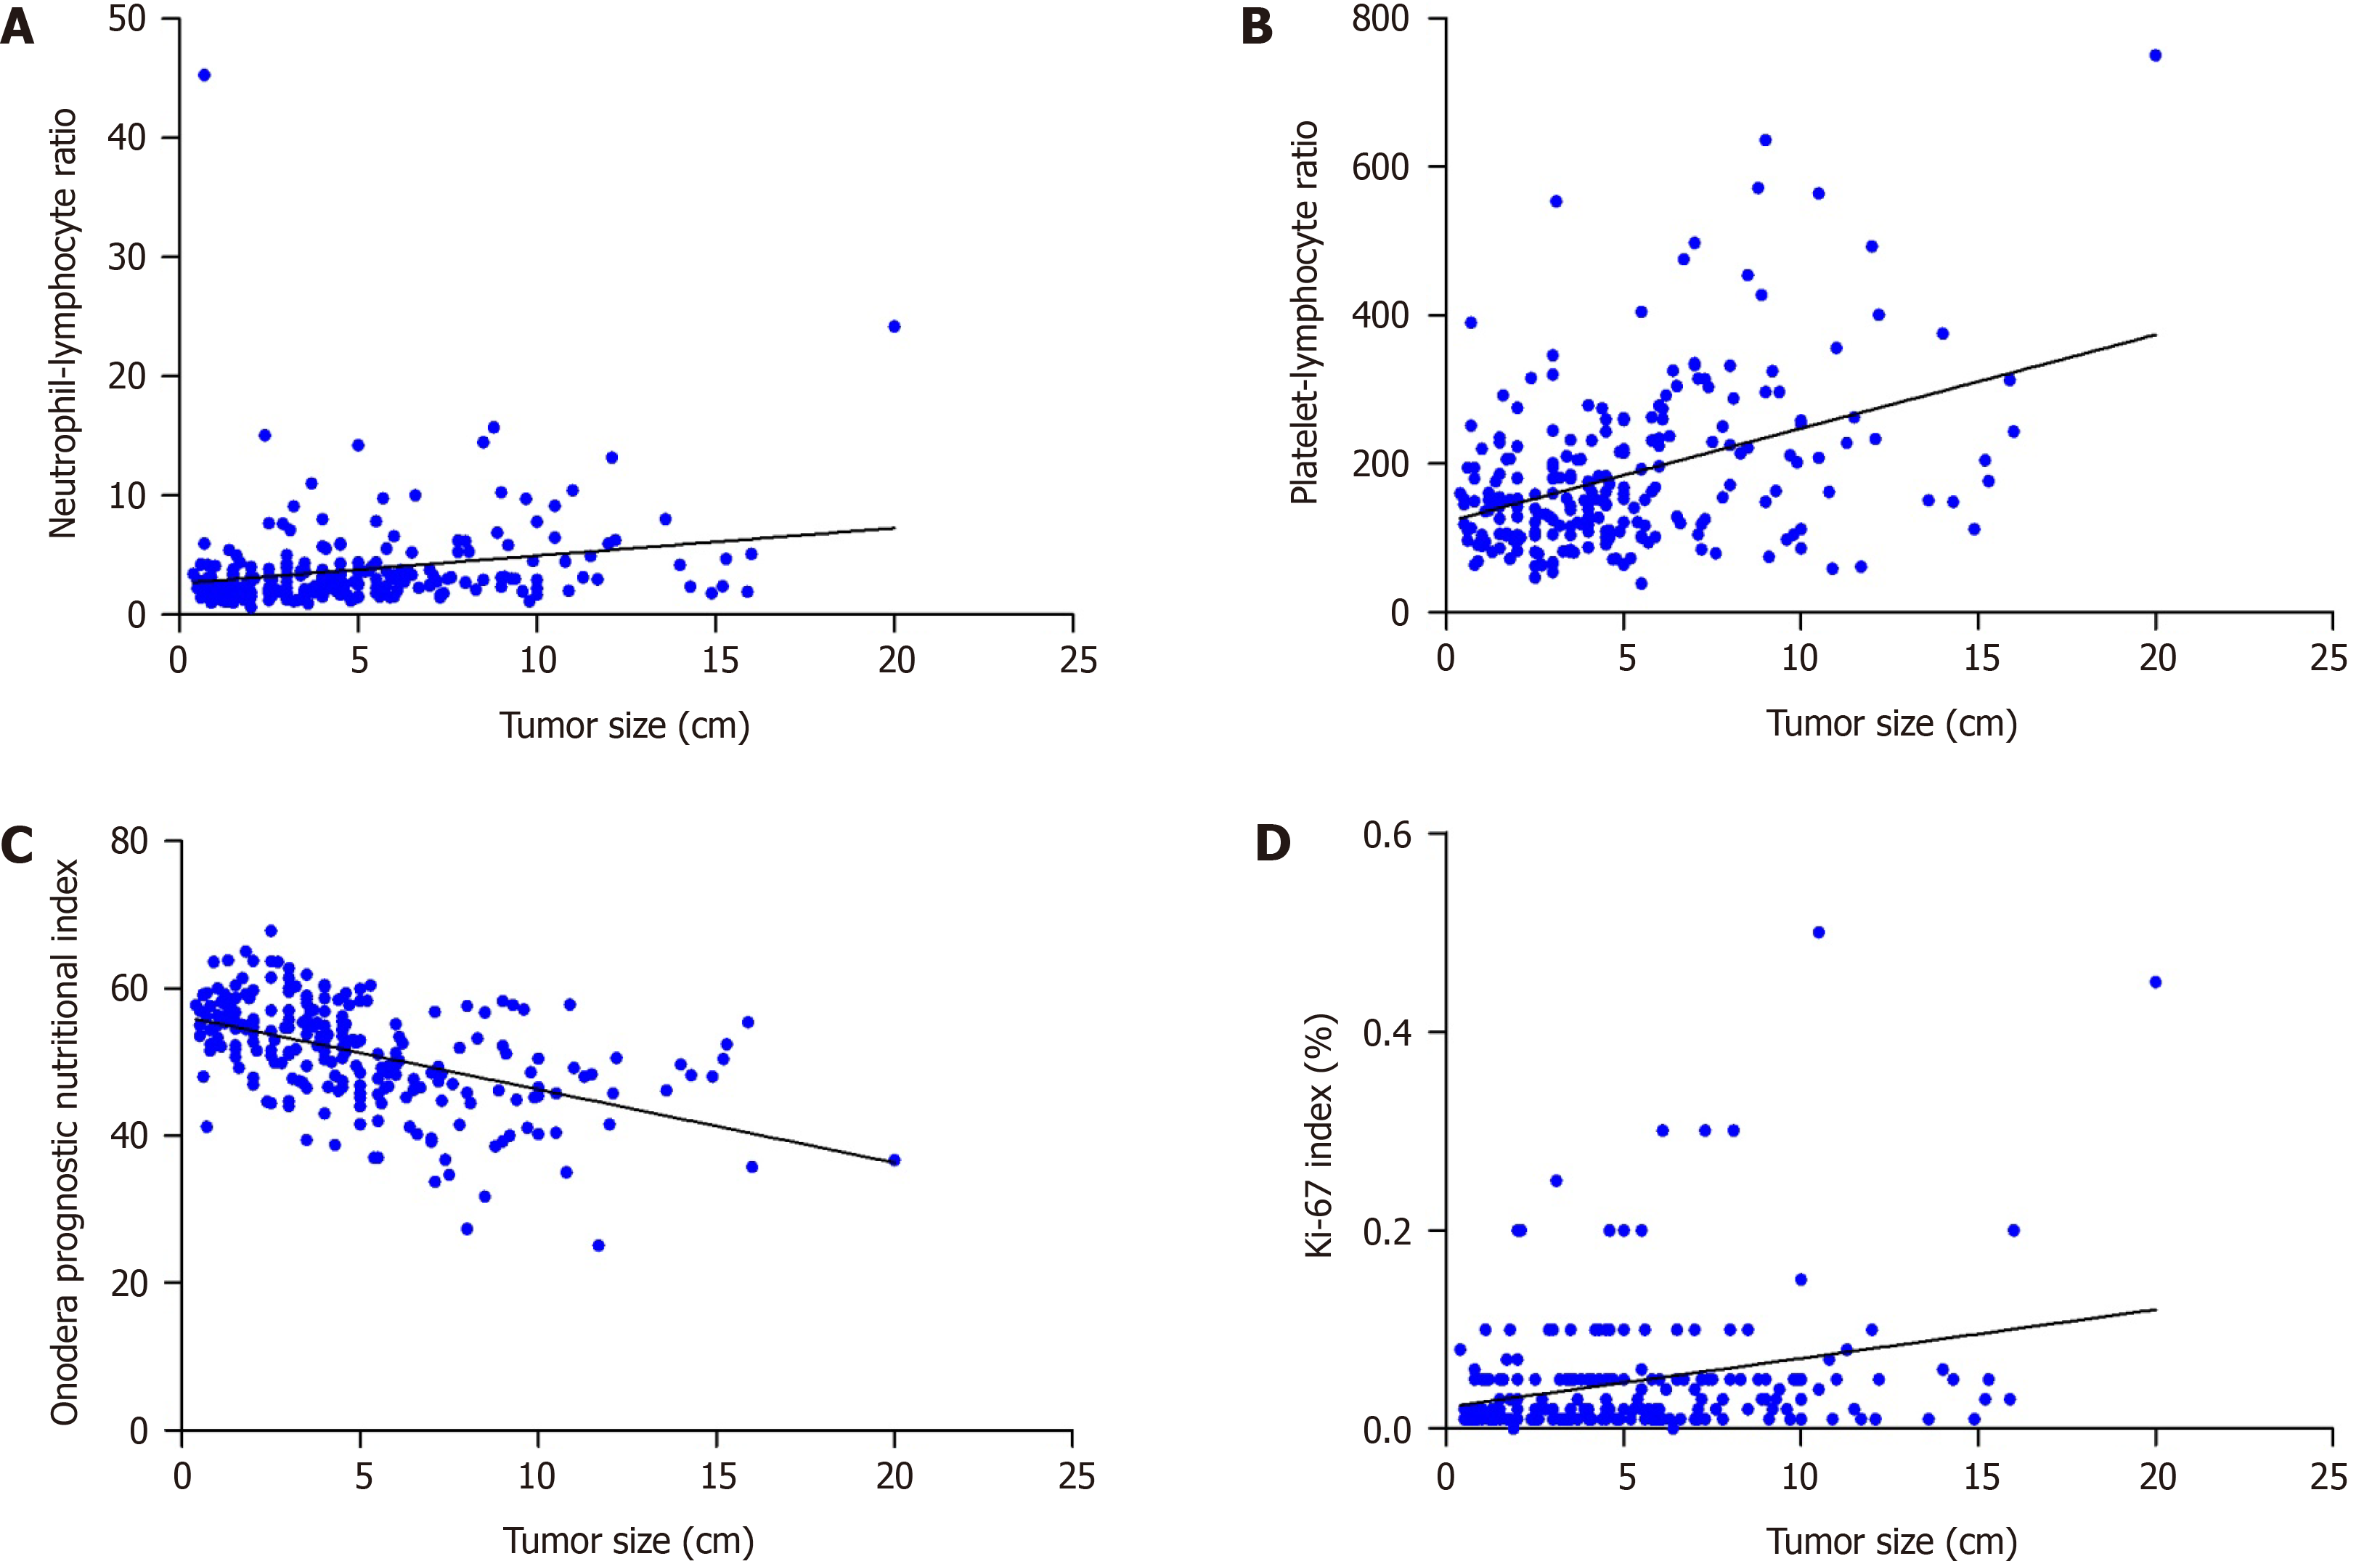
Figure 2 Correlation between gastrointestinal stromal gastrointestinal stromal tumor size and neutrophil-to-lymphocyte ratio, platelet-to-lymphocyte ratio, Onodera’s Prognostic Nutritional Index, and Ki-67 index.
A: Neutrophil-to-lymphocyte ratio; B: Platelet-to-lymphocyte ratio; C: Onodera’s Prognostic Nutritional Index; D: Ki-67 index.
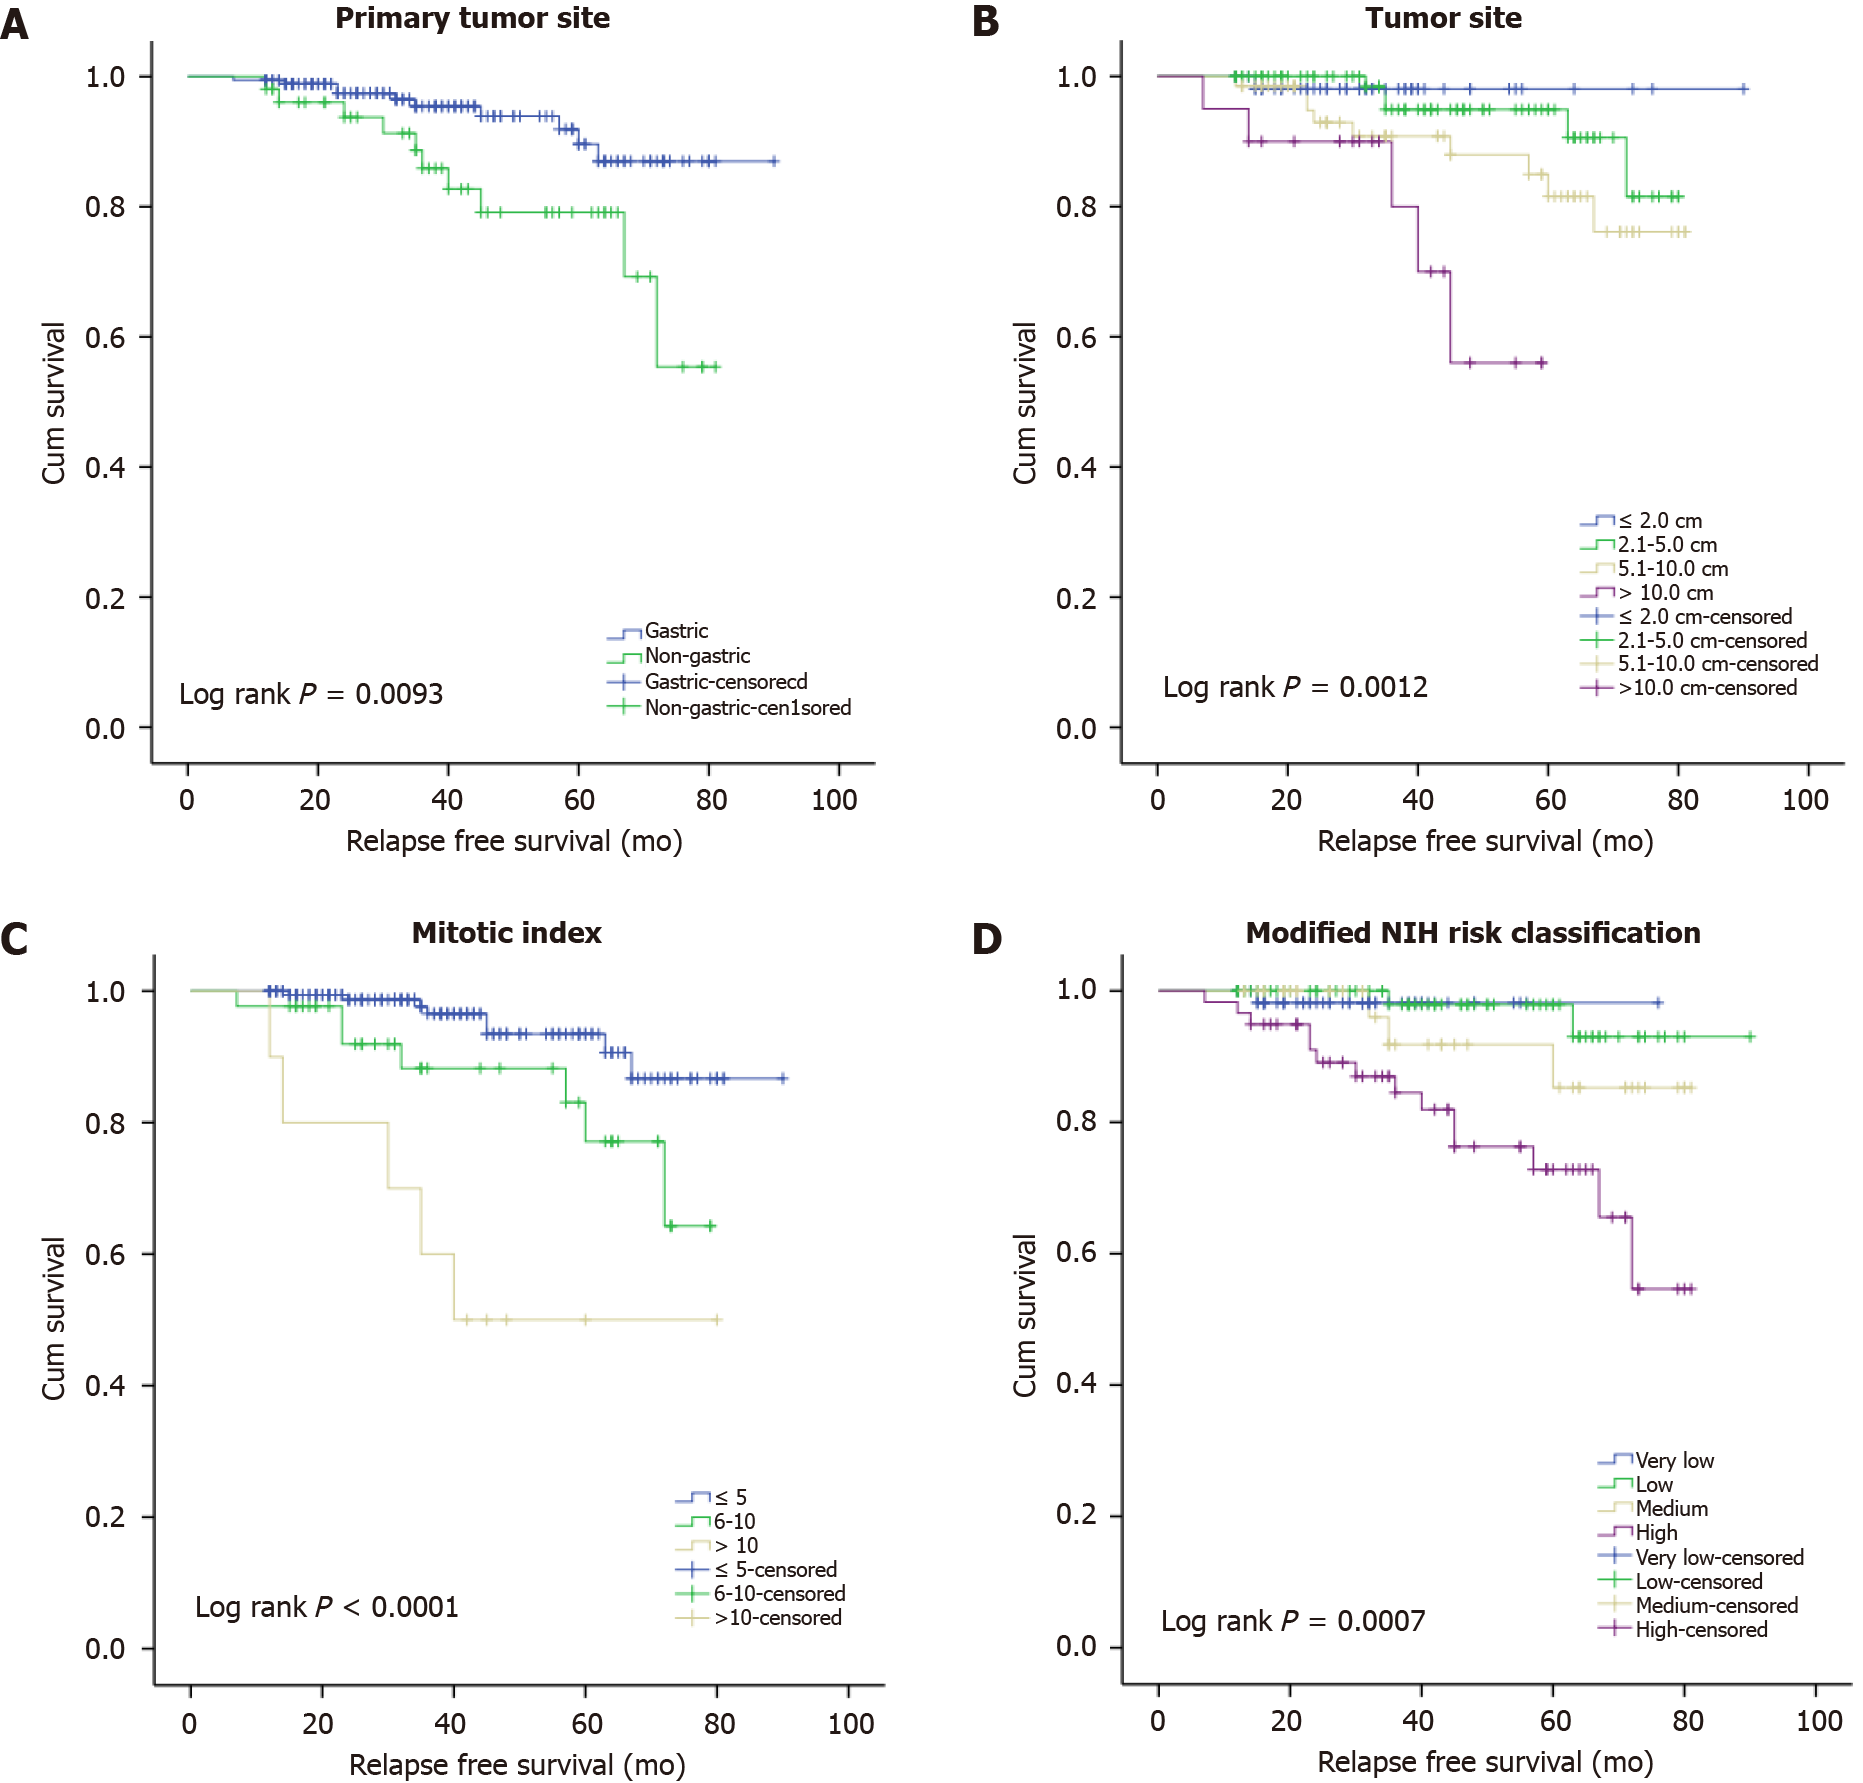
Figure 3 Recurrence-free survival analysis of 235 patients with primary gastrointestinal stromal tumors.
The Kaplan-Meier curve analysis demonstrated worse recurrence-free survival rates for the patients presenting with (A) non-gastric origin, (B) larger tumor size, (C) higher mitotic index, or (D) high modified NIH risk.
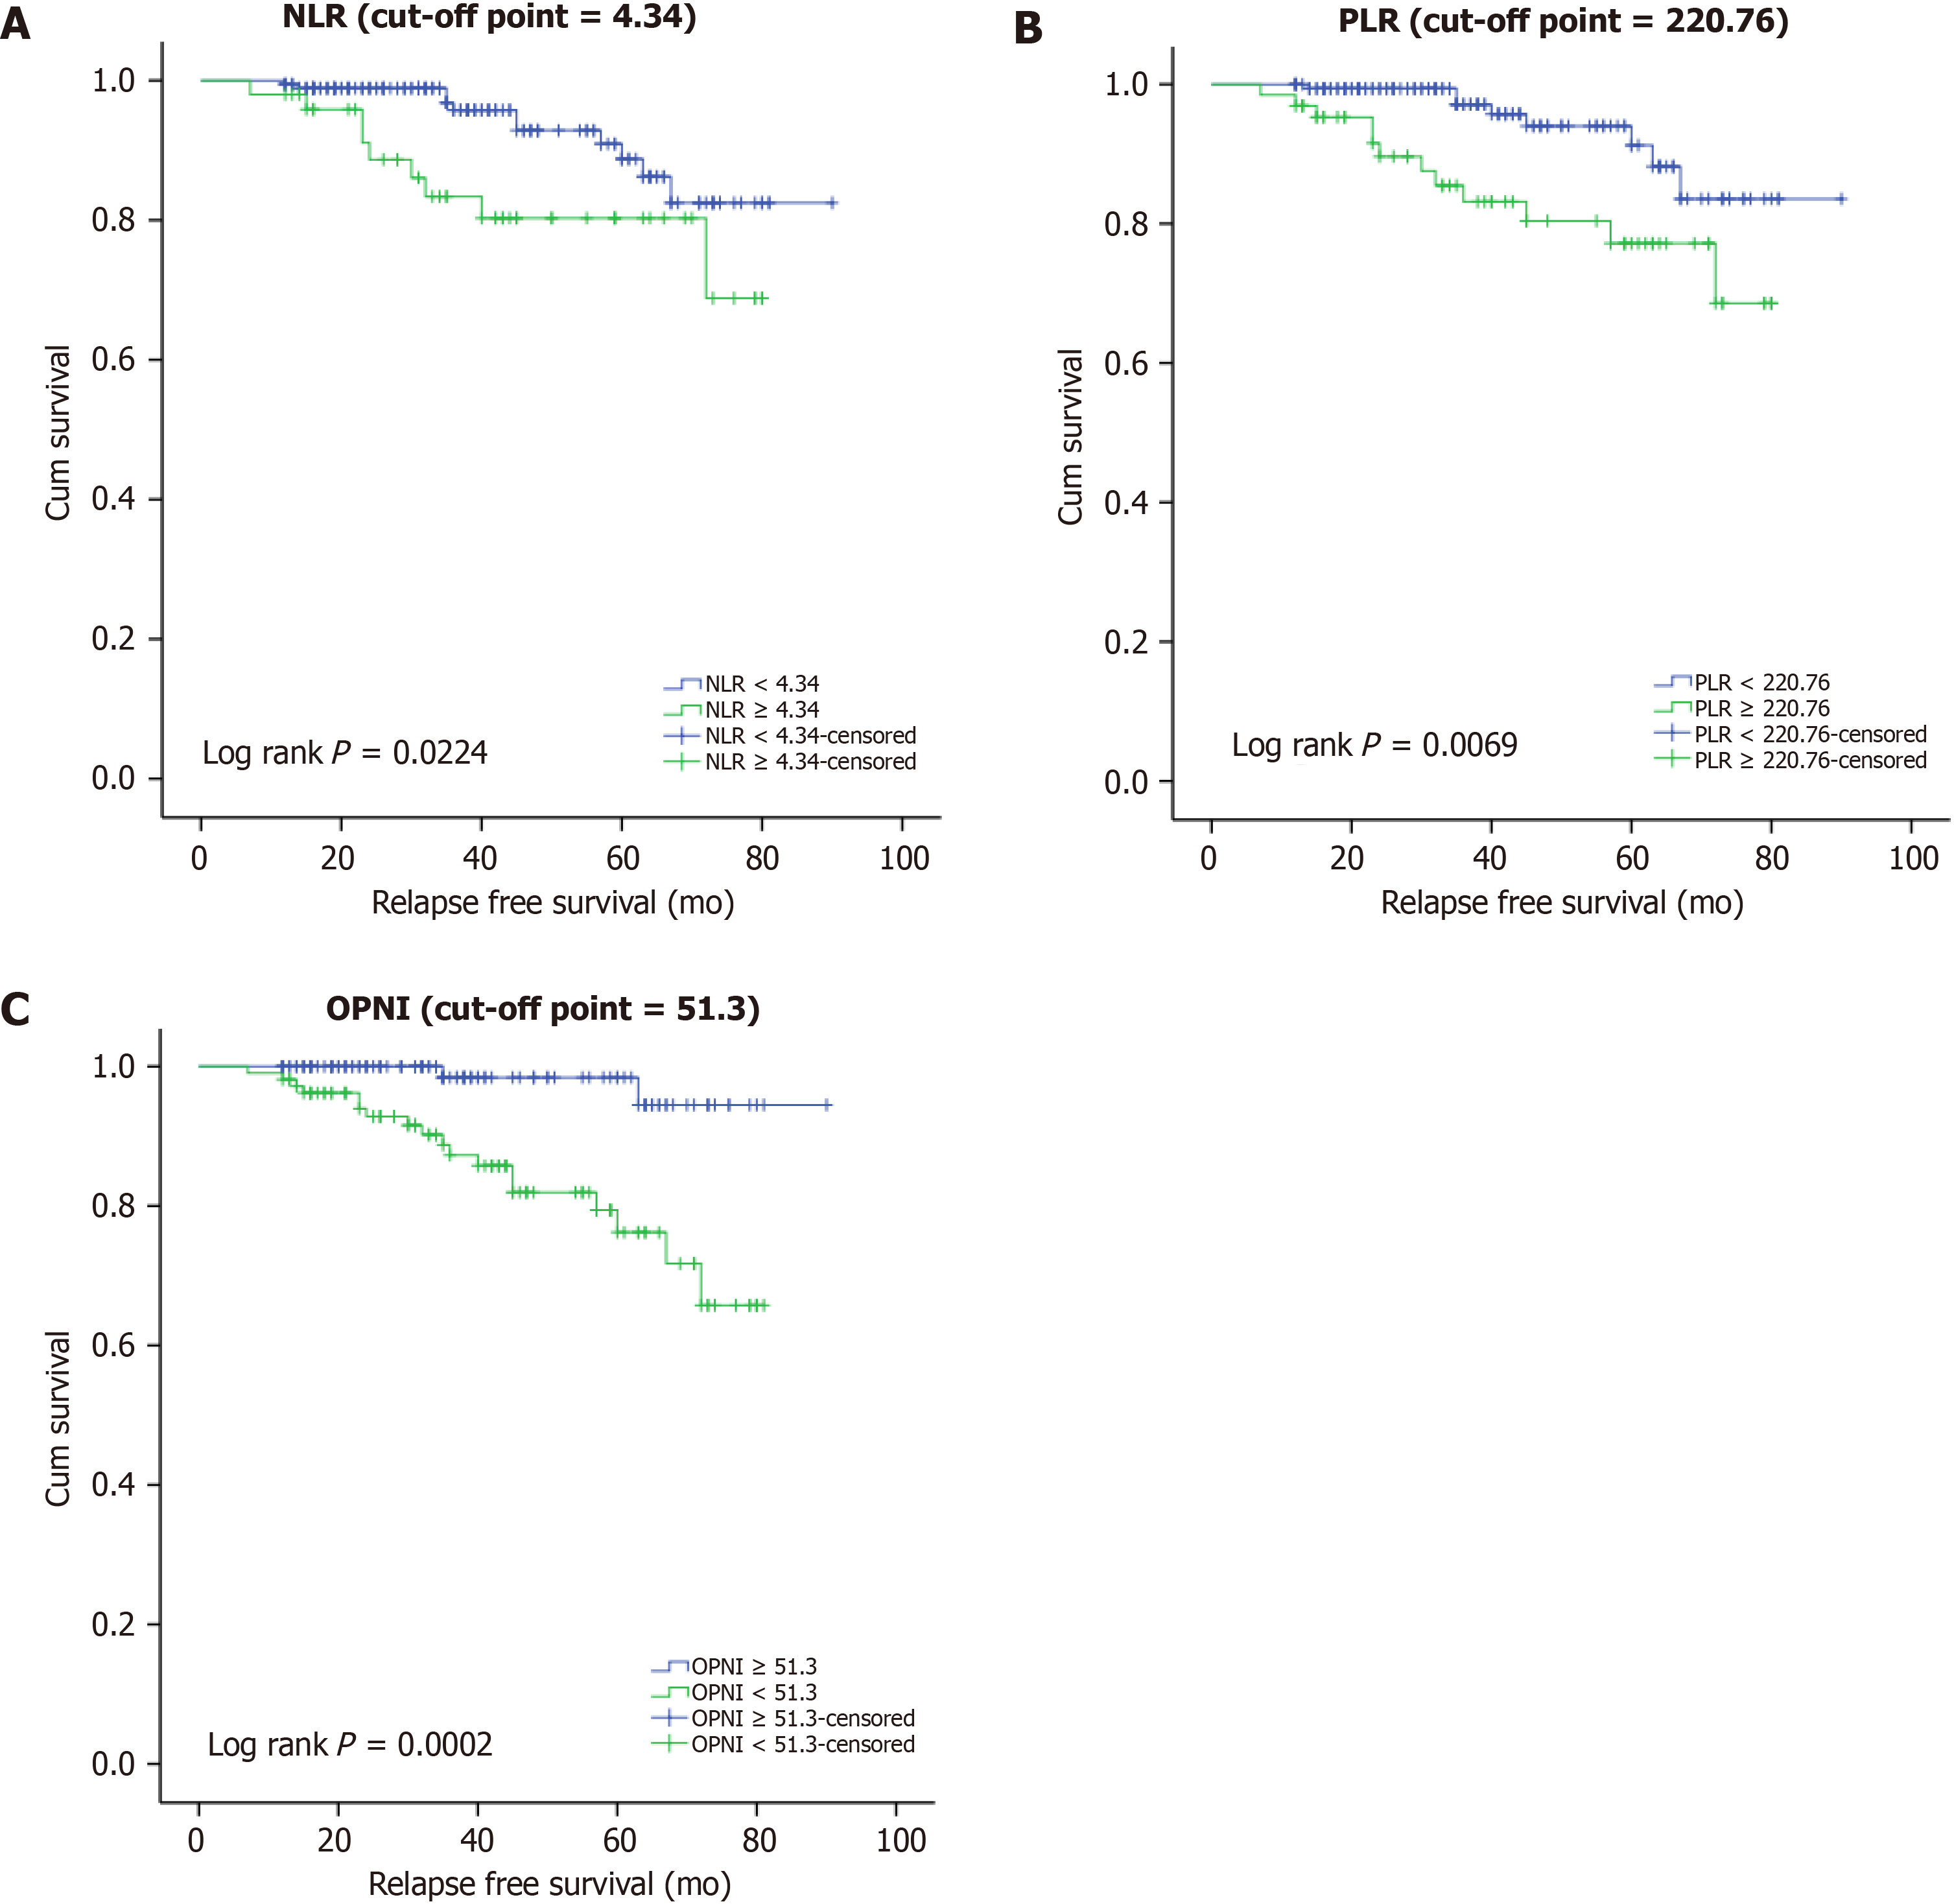
Figure 4 Recurrence-free survival analysis of 235 patients with primary gastrointestinal stromal tumors.
The Kaplan-Meier curve analysis demonstrated worse recurrence-free survival rates for the patients presenting with (A) a higher neutrophil-to-lymphocyte ratio, (B) higher platelet-to-lymphocyte ratio, or (C) lower Onodera’s Prognostic Nutritional Index. NLR: Neutrophil-to-lymphocyte ratio; PLR: Platelet-to-lymphocyte ratio; OPNI: Onodera’s Prognostic Nutritional Index.
- Citation: Wang H, Xu YY, You J, Hu WQ, Wang SF, Chen P, Yang F, Shi L, Zhao W, Zong L. Onodera's Prognostic Nutritional Index is a novel and useful prognostic marker for gastrointestinal stromal tumors. World J Gastrointest Surg 2021; 13(10): 1202-1215
- URL: https://www.wjgnet.com/1948-9366/full/v13/i10/1202.htm
- DOI: https://dx.doi.org/10.4240/wjgs.v13.i10.1202


