
















©The Author(s) 2017.
World J Diabetes. Aug 15, 2017; 8(8): 397-406
Published online Aug 15, 2017. doi: 10.4239/wjd.v8.i8.397
Published online Aug 15, 2017. doi: 10.4239/wjd.v8.i8.397
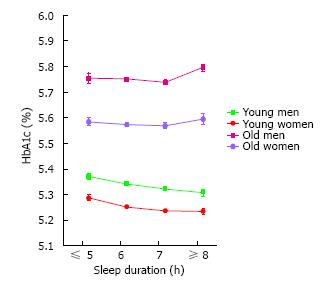
Figure 3 Relationship between HbA1c levels and sleep duration according to age and sex.
Each point and vertical bar represent the mean ± SE. P values for ANOVA were < 0.0001, 0.0001, 0.002, and 0.56 for young men, young women, older men, and older women, respectively. The corresponding number of subjects is shown in the side of the bar.
- Citation: Nakajima K, Suwa K, Toyama K. Age-dependent changes in the association between sleep duration and impaired glucose metabolism. World J Diabetes 2017; 8(8): 397-406
- URL: https://www.wjgnet.com/1948-9358/full/v8/i8/397.htm
- DOI: https://dx.doi.org/10.4239/wjd.v8.i8.397